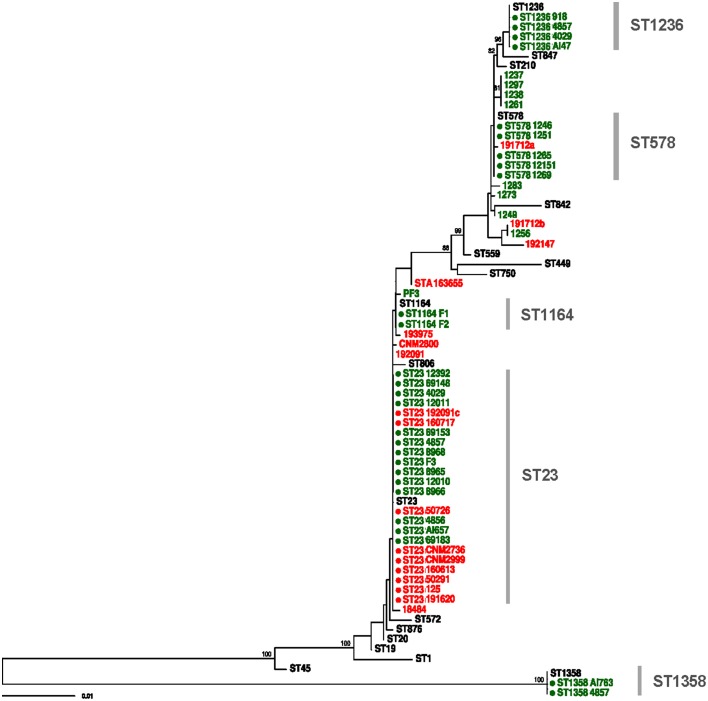
Figure 2.
Maximum likelihood tree constructed with RAxML using SBT data of all clinical and environmental samples included in the study. Red and green tips represent clinical and environmental samples, respectively. Reference STs are shown in black. Complete profiles are marked with a filled circle. Bootstrap support values higher than 70% are shown.

