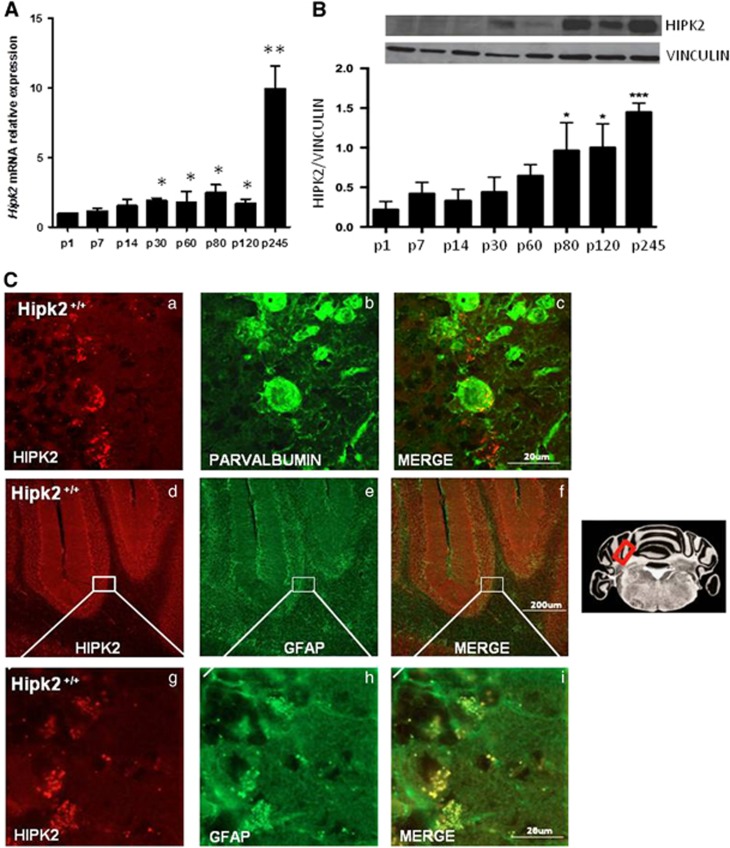
Figure 2.
HIPK2 expression in cerebellum. (A) RNA extracted from cerebellum of wild-type mice at different ages was analyzed by qRT-PCR for Hipk2 expression. The G6pd expression level was used for normalization. ANOVA test was used for statistical analysis. Data represent the mean±S.E.M. *Significant difference (P<0.05) at given time points, n=6 for each age groups. (B) Proteins extracted from cerebellum of wild-type mice were analyzed by western blot analysis for HIPK2 expression. Vinculin was used for normalization. Densitometric analysis of three independent experiments is shown. Student's t-test, n=3 for each group. Data represent the mean±S.D. *P<0.05 and ***P<0.001. One representative of three independent experiments is shown. Confocal images from cerebellar cortex sections of p120 wild-type mice performed with anti-HIPK2 (C a), anti-Parvalbumin (C b) antibodies, and merged images (C c). Scale bars, 20 μm. Immunofluorescence staining performed with anti-HIPK2 (C d) and anti-GFAP antibodies (C e) and Merge (C f) in cerebellar cortex sections from p120 wild-type mice. Scale bars, 200 μm. High magnification of HIPK2 (C g), GFAP (C h), and merge (C i). Scale bars, 20 μm. **P<0.01

