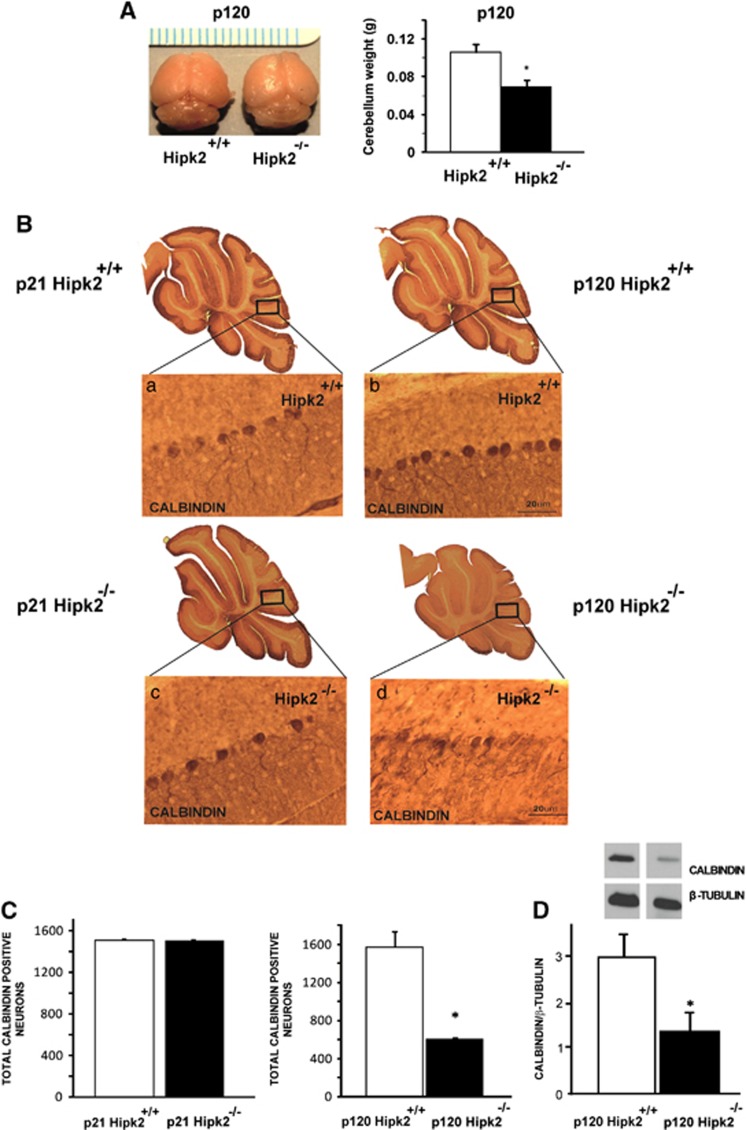
Figure 3.
Absence of HIPK2 reduces Purkinje cells in cerebellum. (A) Macroscopic appearance of P120 wild-type and Hipk2−/− mice. Cerebellum weight of wild-type and Hipk2−/− mice at P120. Student's t-test, n=3 for each genotype. Data represent the mean±S.D. *P<0.05. (B) Representative image of calbindin 3,3′-diaminobenzidine (DAB) staining of wild-type mice and Hipk2−/− mice at P21 and P120. Magnified views of DAB staining of wild type at P21 (a); Hipk2−/− mice at P21 (c); wild-type mice at P120 (b); calbindin DAB staining of Hipk2−/− mice at P120 (d). (C) Cell-counting analysis of calbindin-positive neurons in the cerebellum of P21 and P120 wild-type and Hipk2−/− mice. Student's t-test, n=3 for each genotype. Data represent the mean±S.D. *P<0.05. (D) Representative image of western blot of total extract proteins from cerebellum, performed with anti-calbindin antibodies, is shown. Densitometric analysis of western blot analysis performed with calbindin antibodies is reported. For statistical analysis, Student's t-test, n=3 for each genotype. Data represent the mean±S.D. *P<0.05

