Figure 5.
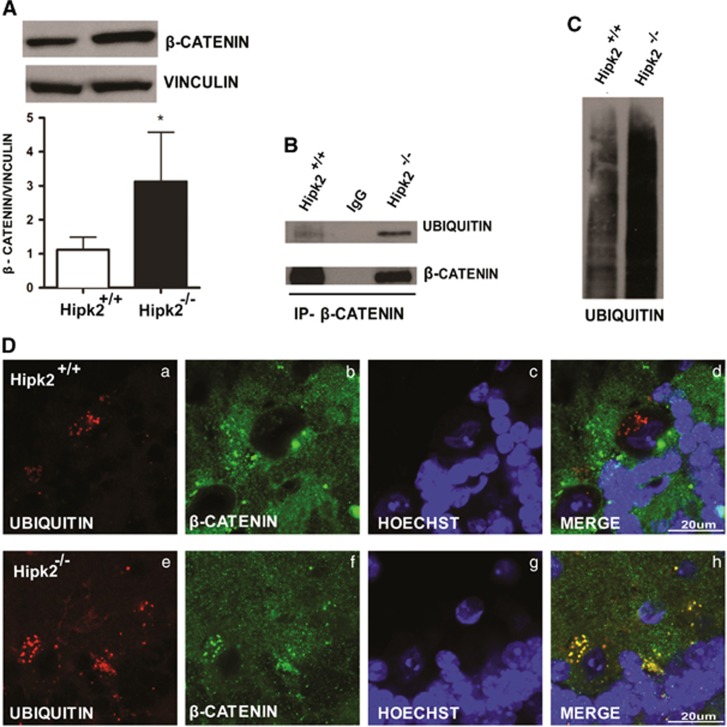
Characterization of β-catenin pathway in the cerebellum of Hipk2−/− mice. (A) β-Catenin protein expression levels evaluated in total extracts of cerebellum from wild-type and Hipk2−/− mice by western blot analysis. Vinculin was used for normalization. One representative experiment is shown. Four samples of wild-type and five samples of Hipk2−/− were used for this analysis. For statistical analysis, Student's t-test was used. Data represent the mean±S.D. *P<0.05. (B) Total extracts from the cerebellum of wild-type and Hipk2−/− mice were immunoprecipitated using anti-β-catenin antibody and analyzed by western blot with anti-ubiquitin and anti-β-catenin antibodies. Polyclonal rabbit IgG was used as negative control. (C) Western blot analysis performed with total extracts from the cerebellum of wild-type and Hipk2−/− mice using anti-ubiquitin antibodies. One representative experiment is shown. Three samples of wild-type mice and three samples of Hipk2−/− mice were used. Confocal images of cerebellar cortex sections from wild-type (D a–d) and Hipk2−/− mice (D e–h) performed with antibodies against ubiquitin (a and e), β-catenin (b and f), and Hoechst (c and g), and merged images (d and h). Scale bar, 200 μm

