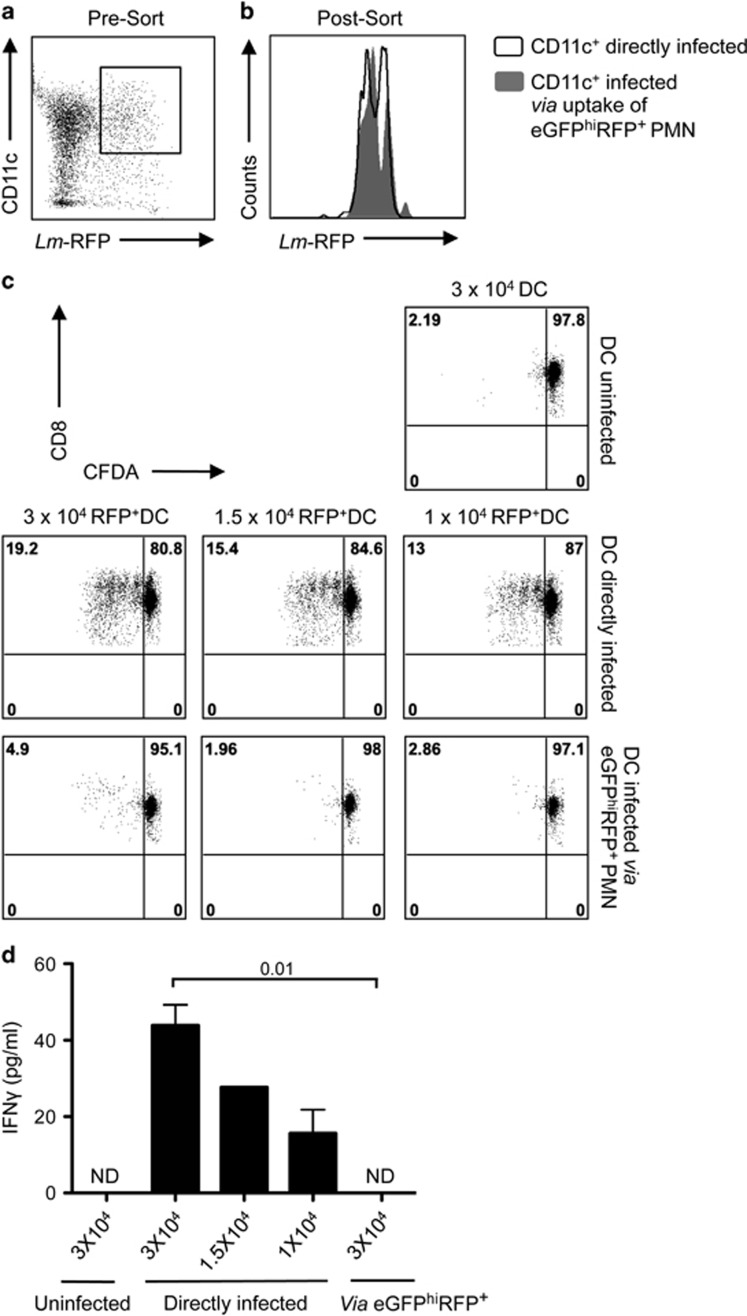
Figure 5.
Presentation of parasite-derived antigen by DCs that have captured L. major-infected neutrophils. (a–d) DCs were infected for 12 h with Lm-NT-OVA-RFP directly (1 : 1 parasite/DC ratio) or via uptake of eGFPhiRFP+-infected (Lm-NT-OVA-RFP) neutrophils (1 : 1 neutrophil/DC ratio). (a) Representative dot plot showing the gate used for sorting of CD11c+RFP+-infected cells. (b) Representative histogram plots of RFP expression by CD11c+ cells directly infected with Lm-NT-OVA-RFP (black line) and CD11c+ cells infected via uptake of eGFPhiRFP+-infected neutrophils (gray filled). (c) Representative dot plots from one of two independent experiments of CFDA fluorescence of OT-I CD8+ T-cell gated populations 3 days after culture with different numbers of uninfected or directly infected DCs or DCs infected via uptake of eGFPhiRFP+ neutrophils. Numbers represent the frequency of cells in each quadrant. (d) IFN-γ levels in supernatant of the cultures described in (c) (mean concentration±1 S.D.) The data are representative of two independent experiments

