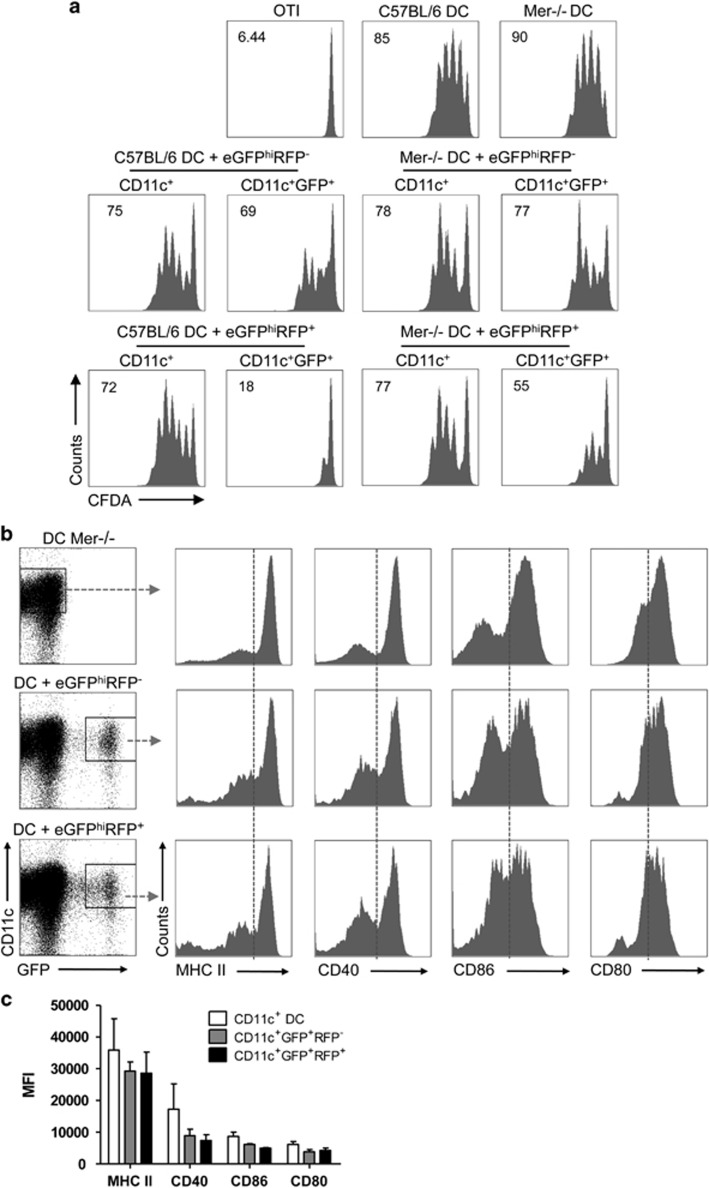
Figure 6.
Antigen presentation function of Mer-deficient DCs following capture of L. major-infected and uninfected neutrophils. C57BL/6 and Mer −/− DCs were cultured or not with eGFPhiRFP−-uninfected and eGFPhiRFP+-infected dermal neutrophils for 12 h. Sorted CD11c+, CD11c+GFP− and CD11c+GFP+ cells were cultured with CFDA-labeled OT-I CD8+ T cells for 3 days in the presence of OVA antigen. (a) Representative histogram plots of CFDA fluorescence of CD8+CD3+ gated cells showing the proliferative response. Numbers represent the frequency of cells with reduced CFDA content. (b) Representative dot plots of Mer−/− DCs cultured or not with eGFPhiRFP- and eGFPhiRFP+ dermal neutrophils for 12 h and analyzed for expression of CD11c and GFP signal. Representative histogram plots of the respective gated populations of CD11c+ and CD11c+GFP+ cells, and stained for MHC II, CD40, CD86 and CD80, are shown. The data are representative of three independent experiments. (c) Mean fluorescence intensity (MFI) of MHC II, CD40, CD86 and CD80 expression on CD11c+ DC (white bars), CD11c+GFP+RFP− (gray bars) and CD11c+GFP+RFP+ (black bars) gated cells. Mean MFI±1 S.D. calculated from three independent experiments

