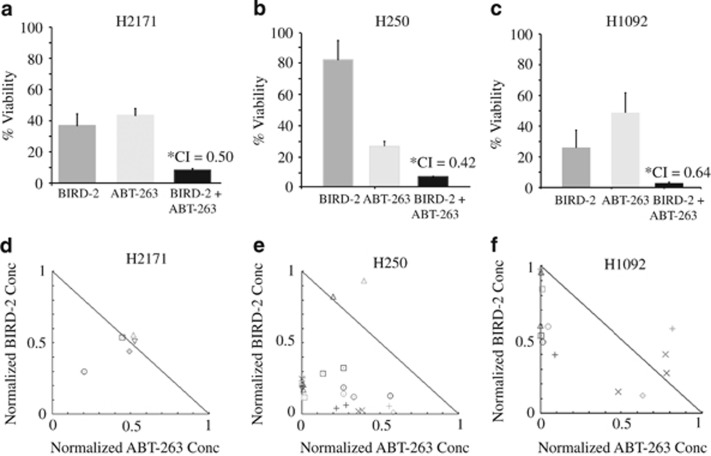
Figure 2.
BIRD-2/ABT-263 synergy. (a–c) SCLC lines were treated with BIRD-2, ABT-263, or 127 : 1 BIRD-2+ABT-263 as in Figure 1g, with cell viability determined by CTG assay. Error bars represent mean±S.D.; N≥3 experiments. Asterisk designates Chou–Talalay CI calculated using the CompuSyn software, where CI<1 indicates synergy. (d–f) Normalized isobolograms for BIRD-2+ABT-263 combinations with plots generated using the CompuSyn software. Each symbol represents a unique combination of a given concentration of ABT-263 and a given concentration of BIRD-2. Symbols below the line indicate synergistic cytotoxicity; symbols on the lines indicate additive cytotoxicity; symbols above the lines indicate antagonism

