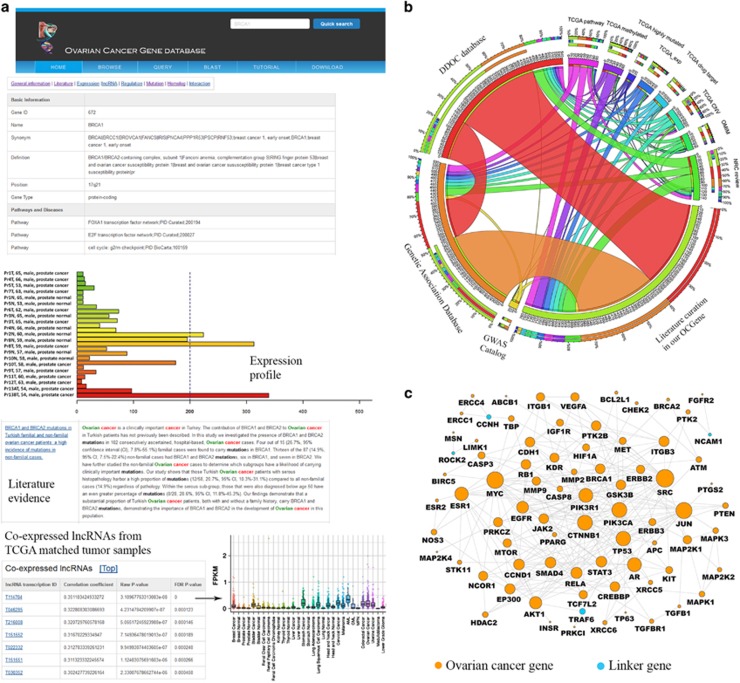
Figure 1.
(a) Web interface of OCGene, including the basic information, gene expression, curated literatures and precomputed lncRNA coexpression results, using TCGA ovarian cancer tumor samples. (b) The shared OC-related genes across multiple data source. The length of circularly arranged segments is proportional to the total genes in each data source. The ribbons connecting different segments represent the number of shared genes between data sources. The three outer rings are stacked bar plots that represent the relative contribution of other data sources to their totals. (c) Reconstructed cellular map using the top-100-ranked OC-related genes based on protein–protein interaction from pathway database. The 74 genes in orange are genes from the top-100-ranked OC-related genes. The remaining five genes in blue are linker genes that bridge the 74 genes

