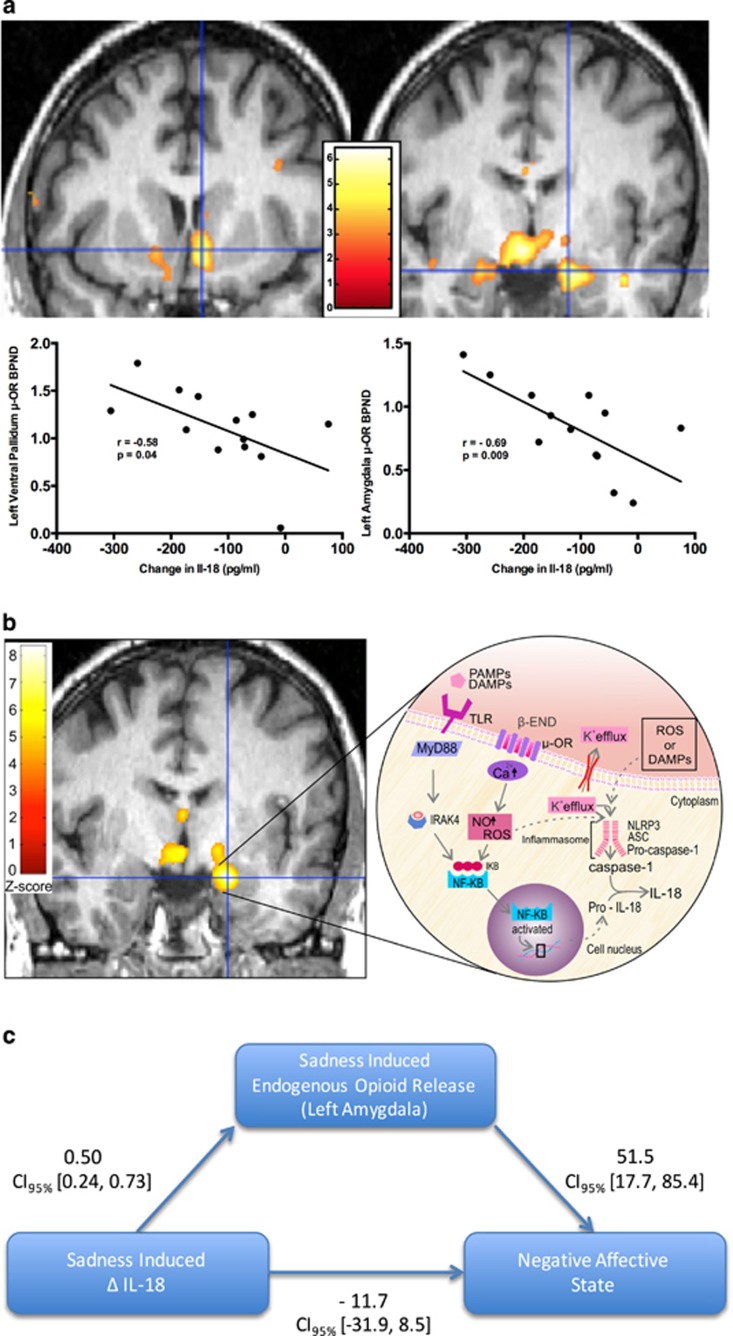
Figure 3.
Here, we present data depicting relationships between brain endogenous opioid functional measures and plasma IL-18 and the impact of mood induction on these relationships. Within the brain images in a and b, the colors (ranging from red to bright yellow/white) represent regional z-scores of statistical significance superimposed on a standardized brain image. Depicted next to the brain images is the z-scale, a color-coded representation of z-scores of statistical significance. On the scales depicted here, dark red represents z-score of 0 and bright yellow (or white) represents z-scores of 6 and 8 in a and b, respectively. For simplicity of presentation, we have chosen not to present statistical images from every region of significance. All regions are outlined in Table 1. The brain images presented in a illustrate correlations between μ-OR availability and reduction in IL-18 during neutral mood induction in MDDs. The greater the reduction in IL-18, the more substantial the μ-OR availability within the brain regions depicted and following neutral mood induction. In a we present findings within both the amygdala (given its stress and immune regulatory roles) and the ventral pallidum. The brain image presented in b illustrates covariance between sadness-induced endogenous opioid release (also referred to as μ-OR activation) and sadness-induced increase in IL-18 in MDDs. The greater the sadness-induced increase in IL-18, the more substantial the sadness-induced endogenous opioid release within the brain regions depicted (centered on the cross-hair in this image is the left amygdala). Also illustrated in b (in the inset of the figure) are potential biological mechanisms underlying the covariate relationships confirmed via statistical testing in SPM. Release of endogenous opioids can contribute to inflammasome activation and a cascade of events resulting in activation and cellular release of IL-18. (c) Illustrates the mediation model tested using the process function29 within SPSS (IBM, Chicago, IL, USA). IL-18, interleukin-18; MDD, major depressive disorder; μ-OR, μ-opioid receptor.

