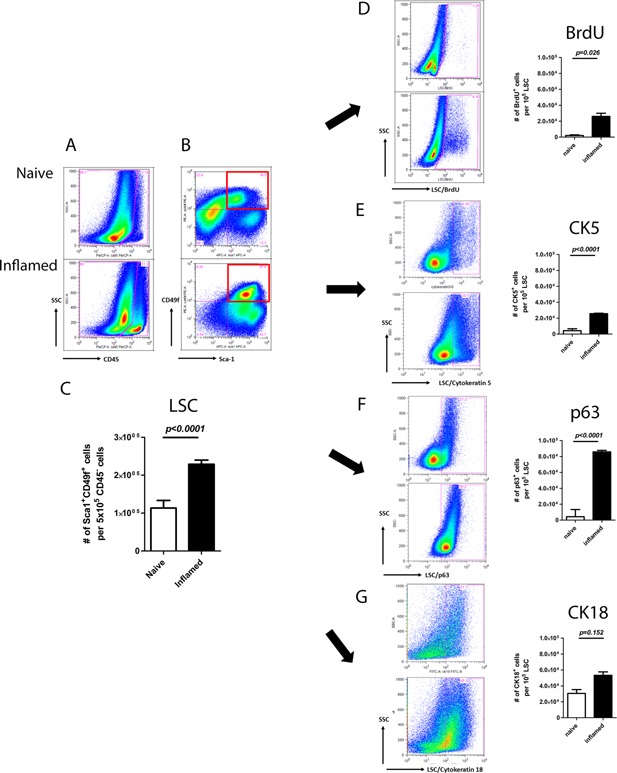
Figure 1.

Induction of inflammation results in elevated prostate progenitor population. In this figure, the FACS plots of naïve and inflamed settings show on the upper and lower rows, respectively. A: CD45+ cells. B: CD45−Sca1+CD49f+ cell (LSC) populations. Red squares gate out LSC population of progenitor cell marker analysis. C: Bar graph of LSC in naïve and inflamed prostates. D: BrdU+ (E) CK5+ (F) p63+ (G) CK18+ cells within LSC population. Bar graphs of different marker expressions are shown along with the corresponding FACS plots (Student's t test was determined by n = 2–12 animals each group; error bar = SE).
