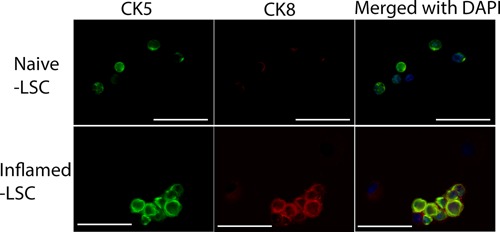
Figure 2.

Representative IF images show the heterogeneity of LSC population in naïve and inflamed LSC, in which inflamed LSC reveals intermediate progenitor cells (CK5 and CK8 co‐expressing cells). The upper panel shows CK5+ cells (green), no CK8+ cells (red), as well as CK5−/CK8− cells in naïve LSC. The lower panel shows CK5+ (green), CK5+/CK8+ (green/red) co‐expressing cells, as well as CK5−/CK8− cells in inflamed LSC (scale bar: 50 μm).
