Fig. 1.

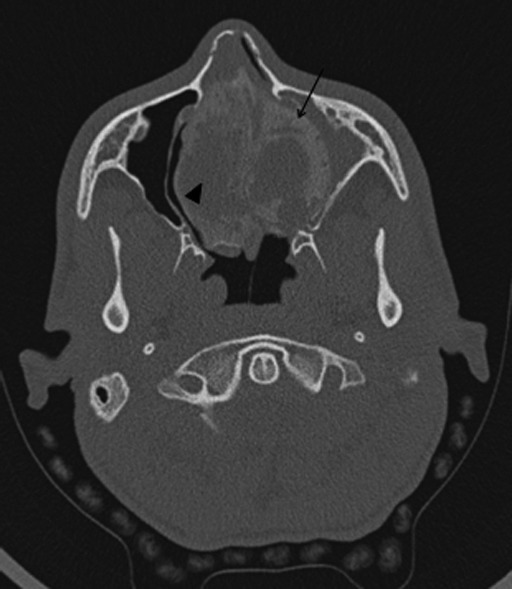
Axial CT: OF appears as a lesion with well-defined margins showing a hypodense signal corresponding to fibrous tissue (arrowhead) with intralesional foci of hyperdensity corresponding to areas of mineralisation (arrow).

Axial CT: OF appears as a lesion with well-defined margins showing a hypodense signal corresponding to fibrous tissue (arrowhead) with intralesional foci of hyperdensity corresponding to areas of mineralisation (arrow).