
Figure 2. Short A-Tails Are Selectively Uridylated by TUT4 and TUT7.
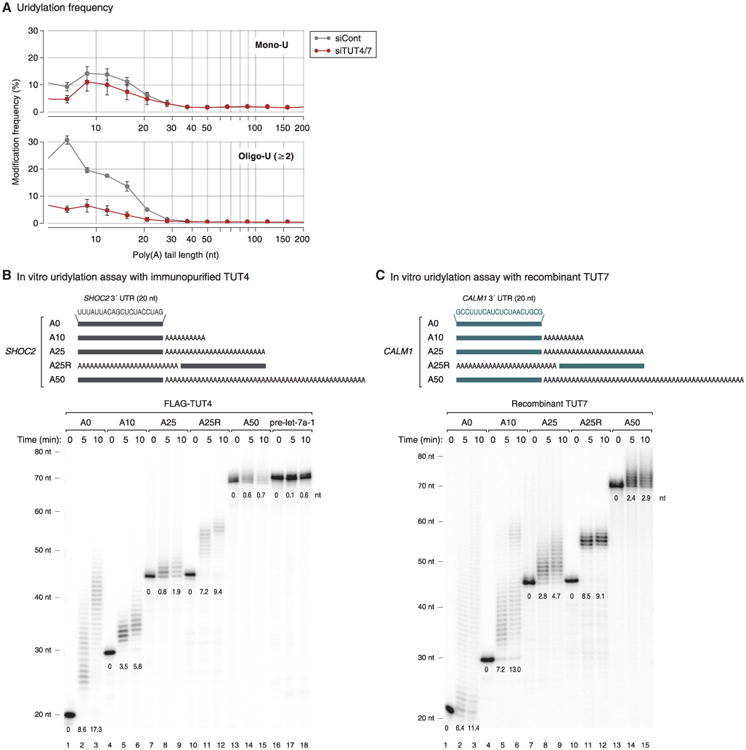
(A) Distribution of mono-uridylation (top) and oligo-uridylation (bottom) according to the length of poly(A) tails. Poly(A) tail lengths from 5 nt to 231 nt are pooled into equal-width bins in the logarithmic scale (base 2) (x axis). The left edges (inclusive) of bins are 5, 7, 9, 12, 15, 21, 28, 38, 50, 67, 89, 119, 159, and 212 nt. Uridylation frequency (y axis) indicates the percentage of uridylated reads within each poly(A) tail size range. Error bar represents SEM (n = 3).
(B) Top: illustration of chemically synthesized RNA substrates. Grey bars represent the last 20 nt of SHOC2 3′ UTR and “A” indicates an adenosine. Bottom: in vitro uridylation assay using immunopurified FLAG-TUT4. RNA (0.45 nM) was used in each reaction. The products were resolved on 6% polyacrylamide sequencing gel containing 7 M urea. The average length of uridylation is shown below each band. See Extended Experimental Procedures for quantification method.
(C) Top: illustration of chemically synthesized RNA substrates. Green bars represent the last 20 nt of CALM1 3′ UTR and “A” indicates an adenosine. Bottom: in vitro uridylation assay using recombinant TUT7 C-terminal fragment (951–1,495 aa) purified from E. coli. RNA (0.45 nM) and 14 nM of recombinant TUT7 were used in each reaction. Extension products were resolved on 6% polyacrylamide sequencing gel containing 7 M urea. The average length of uridylation was quantified as in (B).
See also Figure S2.