
Figure 4. Uridylation Promotes mRNA Degradation.
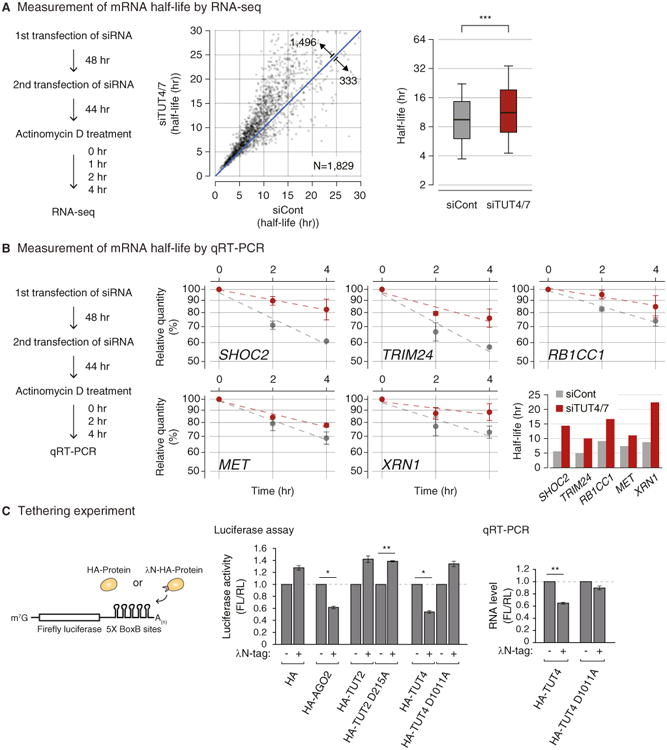
(A) Transcriptome-wide change of mRNA half-life determined by RNA-seq. Left: experimental scheme. HeLa cells were transfected twice and harvested at 0, 1, 2, and 4 hr following actinomycin D treatment. Center: changes of average mRNA half-life upon TUT4/7 knockdown from two biological replicates. The range of display is limited to between 0 and 30 hr for the better visual recognition (232 out of 1,829 mRNAs are outside of the view). The full list is available in Table S2. Right: distribution of mRNA half-lives in control or TUT4/7 knockdown cells. A box represents the first and third quartiles and an internal bar indicates median. Whiskers span between the ninth and the 91st percentiles. Half-lives of mRNAs are significantly extended by TUT4/7 knockdown (***p = 4.06 × 10−155, one-tailed paired Mann-Whitney U test). See Extended Experimental Procedures for the detailed description of procedure.
(B) Measurement of mRNA half-life by qRT-PCR. Left: the experimental scheme. Right: following 0, 2, and 4 hr of actinomycin D treatment, relative abundance (y axis) of five selected genes were measured. For normalization, GAPDH mRNA was used because it was highly stable (half-life > 24 hr, data not shown) and did not change noticeably by TUT4/7 depletion. Error bar represents SEM (n = 3). Half-lives are calculated by linear fitting of the log-transformed exponential decay function.
(C) Left: schematic representation of reporter assay system with the λN tethering. Center: reporter (firefly) luciferase activity was measured and normalized to Renilla luciferase activity (n=3). Right: reporter mRNA levels were determined by qRT-PCR (n = 4). Error bars represent SEM. Luciferase activity or RNA level were significantly reduced when AGO2 or TUT4 were tethered (*p < 0.01, **p < 0.001; two-tailed t test).
See also Figure S4.