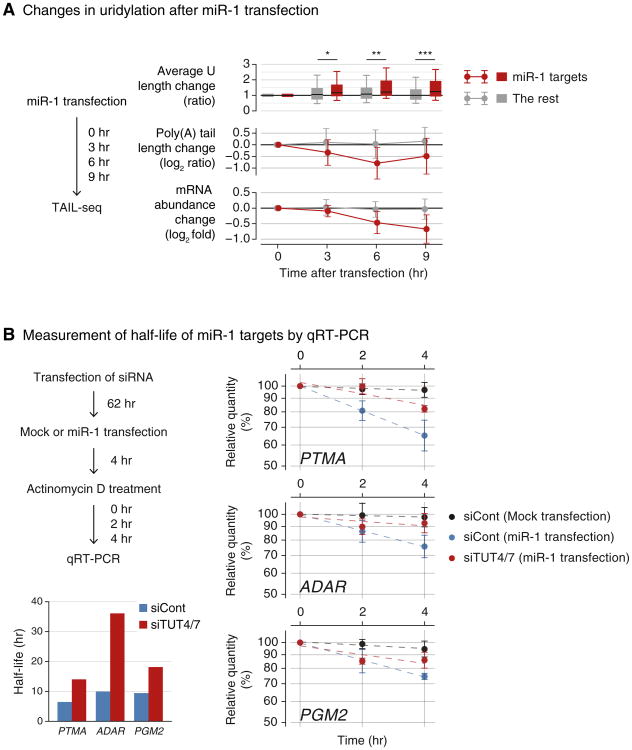
Figure 5. Uridylation Facilitates miRNA-Mediated mRNA Decay.
(A) Changes in uridylation after miR-1 transfection. Left: experimental scheme. miR-1 was transfected into HeLa cells and the cells were harvested after the indicated time for TAIL-seq. Targets are the transcripts with ≥ 1 miR-1 3′ UTR site and down-regulated by ≥30% on 12 hr posttransfection of miR-1 (Guo et al., 2010). Right top: average Ulength change relative to 0 hr is shown in each time point. Average U length per tail is the number of uridines on short A-tails (5–25 nt) divided by the total number of reads with short A-tails. Box represents the interval between the first and third quartiles, and the internal bar indicates the median. Whiskers span between the ninth and 91st percentiles. Average U length of miR-1 target is significantly extended after miR-1 transfection (*p = 0.0152, **p = 0.00318, ***p = 5.79 × 10⁻⁴; one-tailed Mann-Whitney U test). Right middle: poly(A) tail length change relative to 0 hr. The length change is represented by log2 odds ratio between long tails (>25 nt) and short tails (≤25 nt) in one among 3, 6, or 9 hr and 0 hr. A negative value (<0) indicates increase of the fraction of short tails compared to 0 hr. Error bars indicate SD among mRNAs. The portion of short poly(A) tails expanded more for miR-1 targets than the others (p = 1.80 × 10⁻⁶ for 3 hr, p = 8.47 × 10⁻¹³ for 6 hr, p = 1.48 × 10⁻¹¹ for 9 hr; one-tailed Mann-Whitney U test). Right bottom: mRNA abundance (poly(A)+ tag counts) change relative to 0 hr. Error bars indicate SD among mRNAs. Expression levels of miR-1 targets were decreased more than the rest transcripts (p = 2.09 × 10⁻⁴ for 3 hr, p = 2.65 × 10⁻¹⁴ for 6 hr, p = 5.46 × 10⁻¹⁸ for 9 hr; one-tailed Mann-Whitney U test).
(B) Measurement of half-life of miR-1 targets by qRT-PCR. Left: the experimental scheme. Following siRNA transfection for 62 hr, HeLa cells were transfected with miR-1 or mock transfected. After 4 hr, actinomycin D was treated and cells were harvested at 0, 1, 2, and 4 hr. Right: relative abundance (y axis) of miR-1 target mRNAs were measured. For the normalization, highly stable GAPDH mRNA was used because it did not change significantly by siTUT4/7 or miR-1 transfection. Error bar represents SEM (n = 3). Half-lives are determined by linear fitting of the log-transformed exponential decay function.

