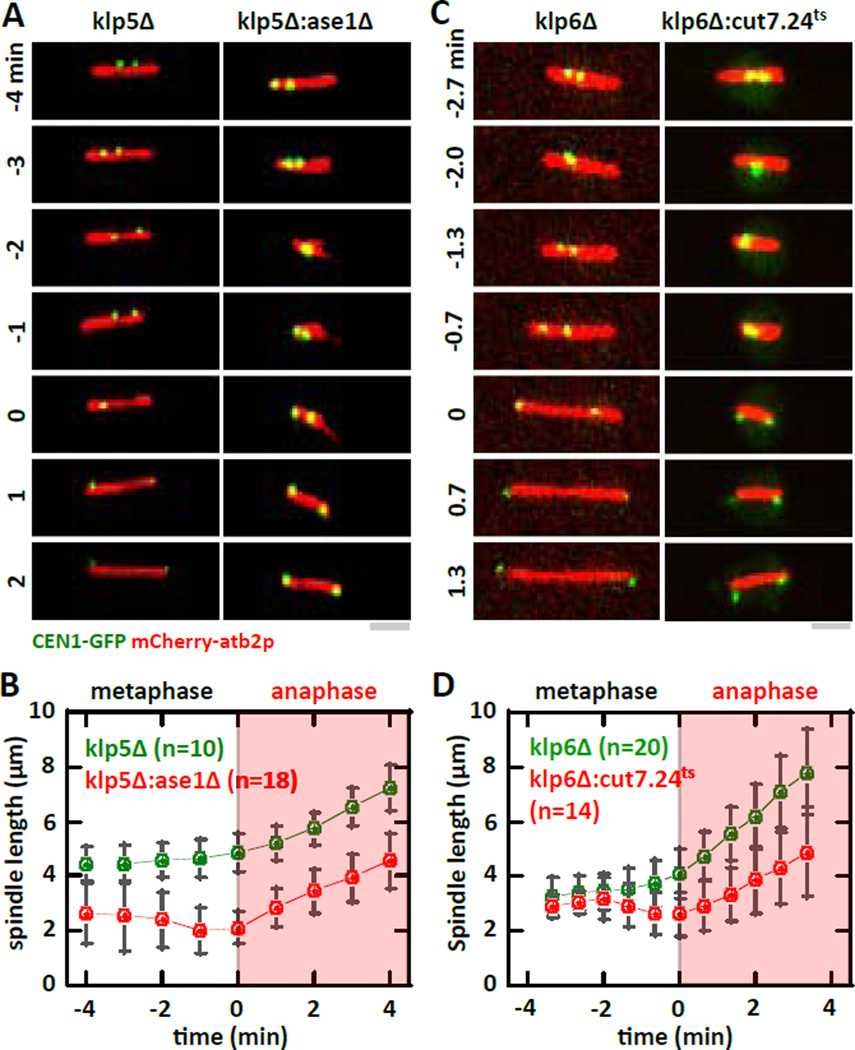
Figure 4. Transient abrupt metaphase spindle length decrease precedes proper chromosome segregation.
(A) Time-lapse images of klp5Δ and klp5Δ:ase1Δ mitotic cells expressing mCherry-atb2p and CEN1-GFP at 23°C. Time 0 represents the transition from metaphase to anaphase A where sister kinetochores are observed to separate to opposite poles. Whereas the metaphase spindle exhibits sustained elongation during the metaphase to anaphase transition in klp5Δ cells, klp5Δ:ase1Δ cells show transient spindle shrinkage prior to the metaphase to anaphase transition. Bar, 1 µm.
(B) Comparative spindle length versus time plot of klp5Δ (green) and klp5Δ:ase1Δ (red) cells. Pole-to-pole distance was measured 4 minute before and 4 minutes after cells exhibit kinetochore separation to opposite poles. At −2 min, the spindle length of the double-mutant exhibits a transient shrinkage.
(C) Time-lapse images of klp6Δ and klp6Δ:cut7.24ts mitotic cells expressing mCherry-atb2p and CEN1-GFP at 37°C. Time 0 represents the transition from metaphase to anaphase A where sister kinetochores are observed to separate to opposite poles. Whereas the metaphase spindle exhibits sustained elongation during the metaphase to anaphase transition in klp6Δ cells, klp6Δ:cut7.24ts cells show transient spindle shrinkage prior to the metaphase to anaphase transition. Bar, 1 µm.
(D) Comparative spindle length versus time plot of klp6Δ (green) and klp6Δ:cut7.24ts (red) cells. Pole-to-pole distance was measured 3.5 minute before and 3.5 minutes after cells exhibit kinetochore separation to opposite poles. At −2 min, the spindle length of the double-mutant exhibits a transient shrinkage.

