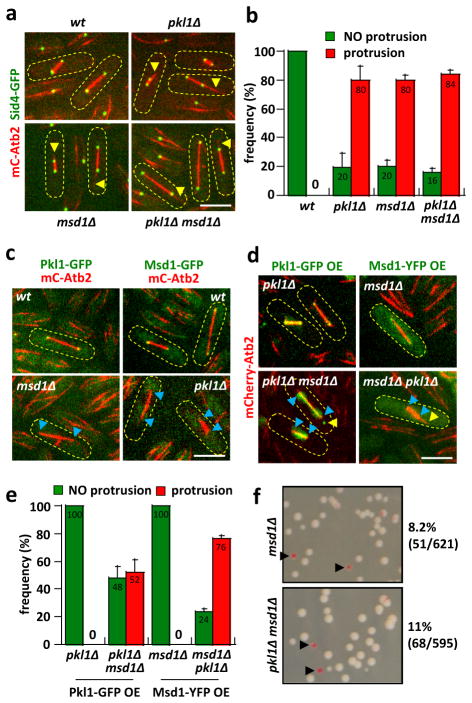
Figure 2. Pkl1 and Msd1 show co-dependent localization to the SPB.
a) Images of mitotic wt, pkl1Δ, msd1Δ, and pkl1Δ msd1Δ cells expressing mCherry-Atb2 and Sid4-GFP. In contrast to wt, which have no aberrant MT protrusions, pkl1Δ, msd1Δ, and pkl1Δ msd1Δ all have similar short and long MT protrusions (yellow arrow head). Scale bar, 5μm.
b) Comparative plot of frequency of MT protrusions in wt (n=20), pkl1Δ (n=47), msd1Δ (n=43), and pkl1Δ msd1Δ (n=47) cells. pkl1Δ, msd1Δ, and pkl1Δ msd1Δ cells have similar frequencies of MT protrusions. Bars represent mean ± s.d. for multiple experiments.
c) Images of spindle pole localization co-dependency between Pkl1 and Msd1. In wt cells, both Pkl1-GFP and Msd1-GFP are at the spindle poles. In msd1Δ cells, Pkl1-GFP is no longer at the spindle pole (blue arrow head). Similarly, in pkl1Δ cells, Msd1-GFP is no longer at the spindle pole (blue arrow head). Scale bar, 5μm.
d) Images of Pkl1-GFP over-expression (OE) in pkl1Δ and pkl1Δ msd1Δ cells; and Msd1-YFP OE in msd1Δ and pkl1Δ cells. Pkl1-GFP OE localizes to the spindle and the spindle poles in pkl1Δ, but not the spindle poles in pkl1Δ msd1Δ cells (blue arrow head). Msd1-YFP OE localizes to the spindle poles in msd1Δ, but not in pkl1Δ cells (blue arrow head). Absence of Pkl1 or Msd1 results in protrusions (yellow arrow head). Scale bar, 5μm.
e) Comparative plot of frequency of MT protrusion in Pkl1-GFP OE and Msd1-YFP OE cells. Pkl1-GFP OE rescues the pkl1Δ MT protrusion (n=45). Over-expression of Pkl1-GFP in pkl1Δ msd1Δ leads to partial rescue of the pkl1Δ protrusion phenotype (n=66), possibly due to Pkl1-dependent MT bundling and focusing ability. Msd1-YFP OE rescues the msd1Δ MT protrusion (n=35). Over-expression of Msd1-YFP in pkl1Δ msd1Δ does not rescue the msd1Δ MT protrusion phenotype (n=43). Bars represent mean ± s.d. for multiple experiments. (See also Supplementary Fig. 2)
f) The artificial mini-chromosome loss assay for msd1Δ and msd1Δ pkl1Δ cells. Pink colonies represent mini-chromosome loss. There is no statistical difference in mini-chromosome loss among pkl1Δ (Fig. 1g), msd1Δ, and msd1Δ pkl1Δ cells (Student-t test, p=0.4). Percentages are pooled from multiple plates.

