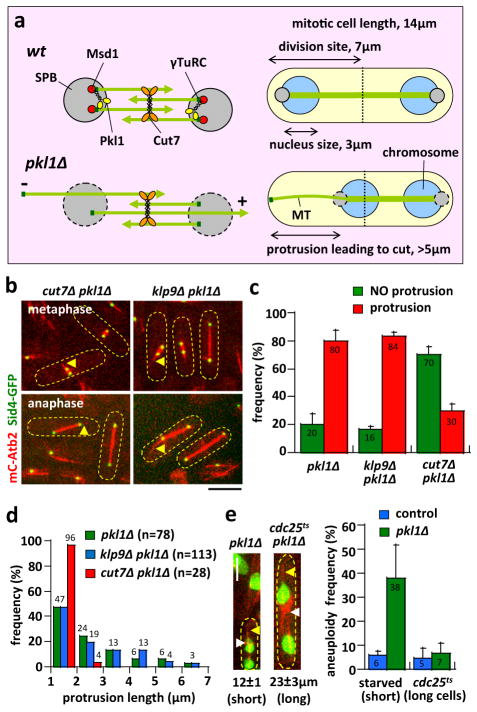
Figure 4. Cut7 slides long MT protrusions in pkl1Δ cells.
a) Kinesin-14 Pkl1 and Msd1 localize to the SPB, where they can bind to the γ-tubulin complex 23, 29. Pkl1 can also crosslink parallel minus end MTs 47. Together, they focus the spindle poles during mitosis. In the absence of Pkl1 (or Msd1), the spindle poles are unfocused. Spindle pushing forces from mitotic kinesin-5 Cut7 can then slide minus end MTs outward away from the unfocused poles. The long MT protrusions can then push the otherwise properly segregated chromosome to the medial cell division site, resulting in chromosome cut and aneuploidy. Unfocused pole can also lead to short plus end MT protrusions (coming from the opposite pole).
b) Images of cut7Δ pkl1Δ and klp9Δ pkl1Δ cells expressing mCherry-Atb2 and Sid4-GFP in metaphase and anaphase. Only short MT protrusions (yellow arrow head) are present in cut7Δ pkl1Δ cells. In contrast, both short and long MT protrusions (yellow arrow head) are seen in klp9Δ pkl1Δ cells. Scale bar, 5μm. (See also Supplementary Fig. 4)
c) Comparative plot of frequency of MT protrusions in pkl1Δ, klp9Δ pkl1Δ, and cut7Δ pkl1Δ cells. Compared to pkl1Δ (n=50), klp9Δ pkl1Δ (n=65) cells show a similarly high frequency of MT protrusions (Chi-squared test, p=0.7). In contrast, cut7Δ pkl1Δ (n=50) cells show a significantly lower frequency of MT protrusions (p<10−25).
d) Plot of MT protrusion length distribution frequency in pkl1Δ, klp9Δ pkl1Δ, and cut7Δ pkl1Δ cells. All MT protrusions in cut7Δ pkl1Δ cells are shorter than 3μm. In contrast, both pkl1Δ and klp9Δ pkl1Δ cells have similar distributions of short and long MT protrusions. Frequencies are pooled from multiple experiments.
e) Comparative plot of frequency of aneuploid cells in short and long mitotic cells. wt (control) and pkl1Δ cells were made short by starvation. The average length of short control mitotic cells is 12±1 μm (n=72). cdc25ts (control) and cdc25ts pkl1Δ cells are made long by overnight growth at 25°C. The average length of control long mitotic cells is 24±4 μm (n=89). Note that wt and pkl1Δ cells in non-starved growth condition reaches length of 14±1 μm (n=100). Bars represent mean ± s.d. for multiple experiments.

