
Fig. 2. The enhanced development of PCs in B-Traf3−/− mice is IL-6–dependent.
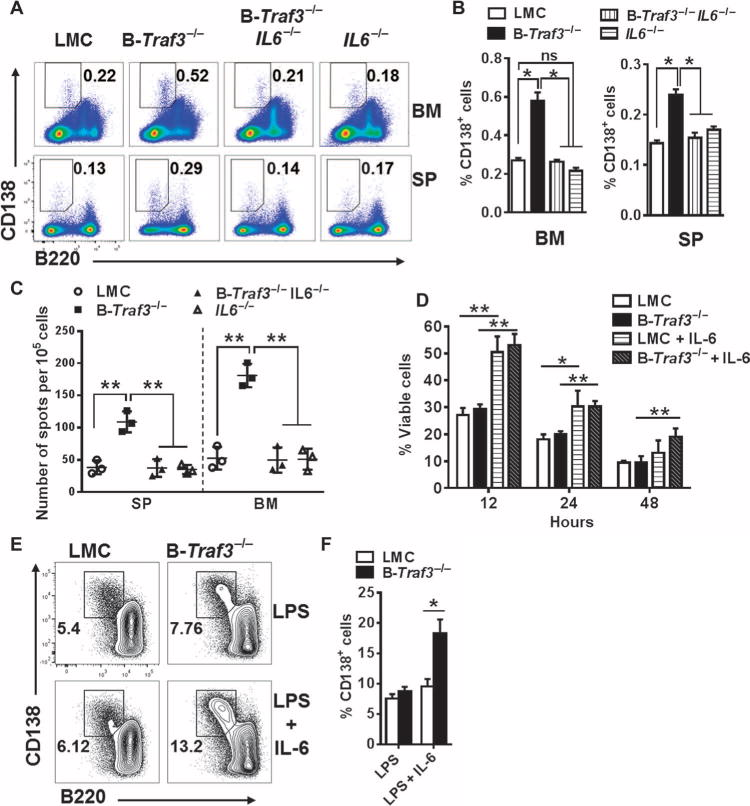
(A) Representative plots from the flow cytometric analysis of spleen and bone marrow cells from littermate control mice, B-Traf3−/−, IL6−/−, and B-Traf3−/− IL6−/− mice. Outlined areas and numbers indicate the percentages of CD138+B220low PCs. (B) Quantification of the percentages of PCs in the bone marrow (left) and spleens (right) of the indicated mice from the experiments depicted in (A). Data are means ± SEM of values from at least four mice from each group. *P < 0.05; ns, not statistically significant. (C) ELISPOT analysis of splenocytes and bone marrow cells from the indicated mouse strains. The graph shows the numbers of ASCs; each symbol represents a technical triplicate, whereas the lines indicate the mean values from three mice per group. **P < 0.01 by one-way analysis of variance (ANOVA). (D) Sorted PCs from the bone marrow of the indicated strains of mice were cultured in the presence or absence of IL-6 (50 ng/ml) for the indicated times. The percentage cell viability in each sample was determined by flow cytometric analysis of the percentage of propidium iodide (PI)–negative cells. Data are means ± SEM from three independent experiments. **P< 0.01, *P< 0.05 by one-way ANOVA. (E) Splenic B cells from the indicated mice were stimulated with LPS(10μg/ml) in the presence or absence of IL-6 (20 ng/ml) for 3 days before they were analyzed by flow cytometry to detect CD138+B220low PCs. Numbers in the plots represent the percentages of CD138+B220low PCs. (F) Quantification of the percentages of CD 138+B220low PCs in the experiments shown in (E). Data are means ± SEM values from three independent experiments. *P < 0.05 by Student’s t test.