
Fig. 3. TRAF3 inhibits the IL-6–dependent activation of STAT3.
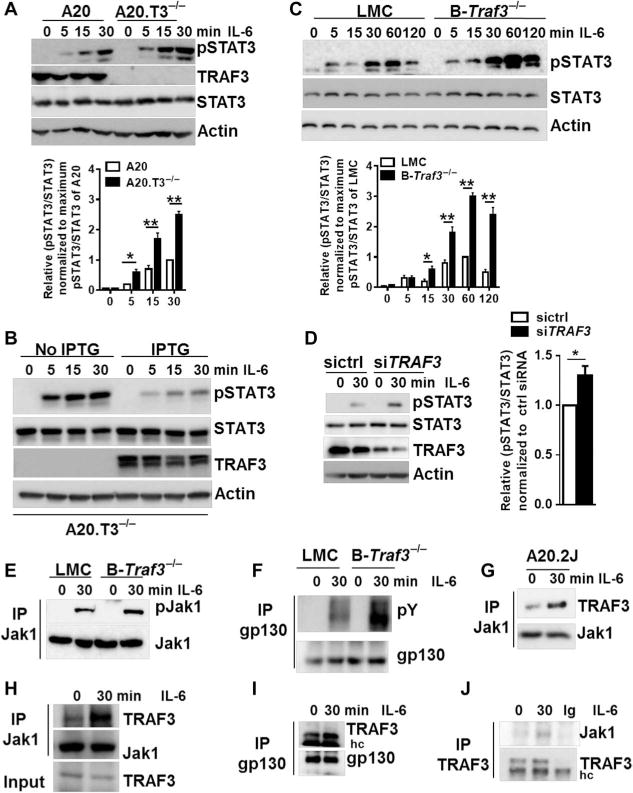
(A) Top: TRAF3-sufficient and TRAF3-deficient subclones of the mouse B cell line A20.2J (A20 and A20.T3−/− cells, respectively) were left untreated or were stimulated with IL-6 for the indicated times. Whole-cell lysates were then subjected to Western blotting analysis with antibodies against the indicated proteins. Western blots are representative of three independent experiments. Bottom: Densitometric analysis of the ratio of the abundance of pSTAT3 protein to that of total STAT3 protein, setting the maximum ratio in TRAF3-sufficient B cells at 1. Data are means ± SD of three independent experiments. (B) A20.T3−/− cells were stably transfected with a plasmid encoding IPTG-inducible Traf3. Cells were cultured in the presence or absence of IPTG for 12 hours before being stimulated with IL-6 for the indicated times and then analyzed by Western blotting with antibodies against the indicated proteins. Western blots are from one experiment and are representative of three independent experiments. (C) Top: Splenic B cells from the indicated mice were left unstimulated or were stimulated with IL-6 for the indicated times before being analyzed by Western blotting as described in (A). Western blots are representative of five individual experiments. Bottom: Densitometric analysis of the ratio of the abundance of pSTAT3 protein to that of total STAT3 protein, setting the maximum ratio in TRAF3-sufficient B cells at 1. Data are means ± SD of five independent experiments. (D) Left: Normal human peripheral B cells isolated as described in Materials and Methods were transfected with the indicated siRNAs before being left untreated or treated with recombinant human IL-6 for 30 min. Samples were then analyzed by Western blotting as described in (A). Western blots are from a single experiment and are representative of three experiments. Right: Data are means ± SEM of the ratio of the abundances of pSTAT3 protein to total STAT3 protein from three experiments, setting the maximum ratio in cells transfected with control siRNA (sictrl) at 1. *P < 0.05 by Student’s t test. (E and F) Splenic B cells from the indicated mice were left untreated or were stimulated with IL-6 for 30 min before being subjected to immunoprecipitation (IP) of (E) Jak1 or (F) gp130. Samples were then analyzed by Western blotting with antibodies specific for (E) pJak1 and total Jak1 or (F) phosphotyrosines (pY) and gp130. Western blots are from a single experiment and are representative of four experiments. (Gto I) A20.2J cell lines (G) or splenic B cells (H and I) were left untreated or were treated with IL-6 for the indicated times. Cell lysates were then subjected to immunoprecipitation with antibodies against the indicated proteins before being analyzed by Western blotting. Blots are from a single experiment and are representative of two independent experiments. (J) Human B cells were left untreated or were treated with recombinant human IL-6 for 30 min. Cell lysates were then subjected to immunoprecipitation with antibody against TRAF3, and the samples were then analyzed by Western blotting with antibodies against the indicated proteins. Western blots are from a single experiment and are representative of two independent experiments. hc, heavy chain.