
Fig. 4. TRAF3 interacts with PTPN22 to inhibit IL-6R signaling and PC development.
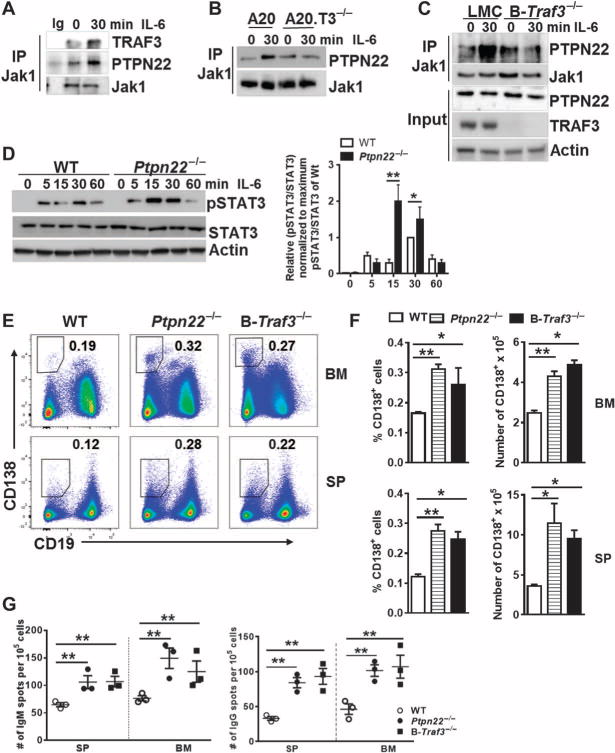
(A and B) Splenic B cells (A) and the indicated A20.2J cell lines (B) were left untreated or were treated with IL-6 for 30 min before being subjected to immunoprecipitation with an antibody specific for Jak1. An IgG control was included to control for the specificity of the anti-Jak1 antibody. Immunoprecipitates were then analyzed by Western blotting with antibodies specific for the indicated proteins. Blots are from a single experiment and are representative of three independent experiments. (C) Splenic B cells from the indicated mice were left untreated or were treated with IL-6 for 30 min. Whole-cell lysates were subjected to the immunoprecipitation of Jak1, and samples were then analyzed by Western blotting to detect PTPN22. As a control, whole-cell lysates (input) were also analyzed. Blots are from a single experiment and are representative of three independent experiments. (D) Left: Splenic B cells from the indicated mice were left untreated or were treated with IL-6 for the indicated times. Whole-cell lysates were then analyzed by Western blotting with antibodies against the indicated targets. Western blots are representative of three individual experiments. Right: Densitometric analysis of the ratio of the abundance of pSTAT3 protein to that of total STAT3 protein, setting the maximum ratio in PTPN22-sufficient B cells at 1. Data are means ± SD of five independent experiments. (E) Representative plots from the flow cytometric analysis of CD138+B220low PCs in the spleen and bone marrow of the indicated mice. The outlined areas and numbers indicate the percentages of the CD138+B220low PCs. (F) Quantification of the percentages of CD138+B220low PCs in the bone marrow (top) and spleens (bottom) of the indicated mouse strains from the experiments depicted in (E). Data are means ± SEM of six (Ptpn22−/−), four [wild type (WT)], and three (B-Traf3−/−) mice. (G) ELISPOT analysis of IgM-secreting (left) and IgG-secreting (right) ASCs in the spleen and bone marrow of the indicated mice. The graph represents the numbers of ASCs from the bone marrow and spleen. Each symbol represents the mean of technical triplicates from a single mouse, whereas the horizontal lines indicate means from three mice per group. *P < 0.05, **P < 0.01 by one-way ANOVA.