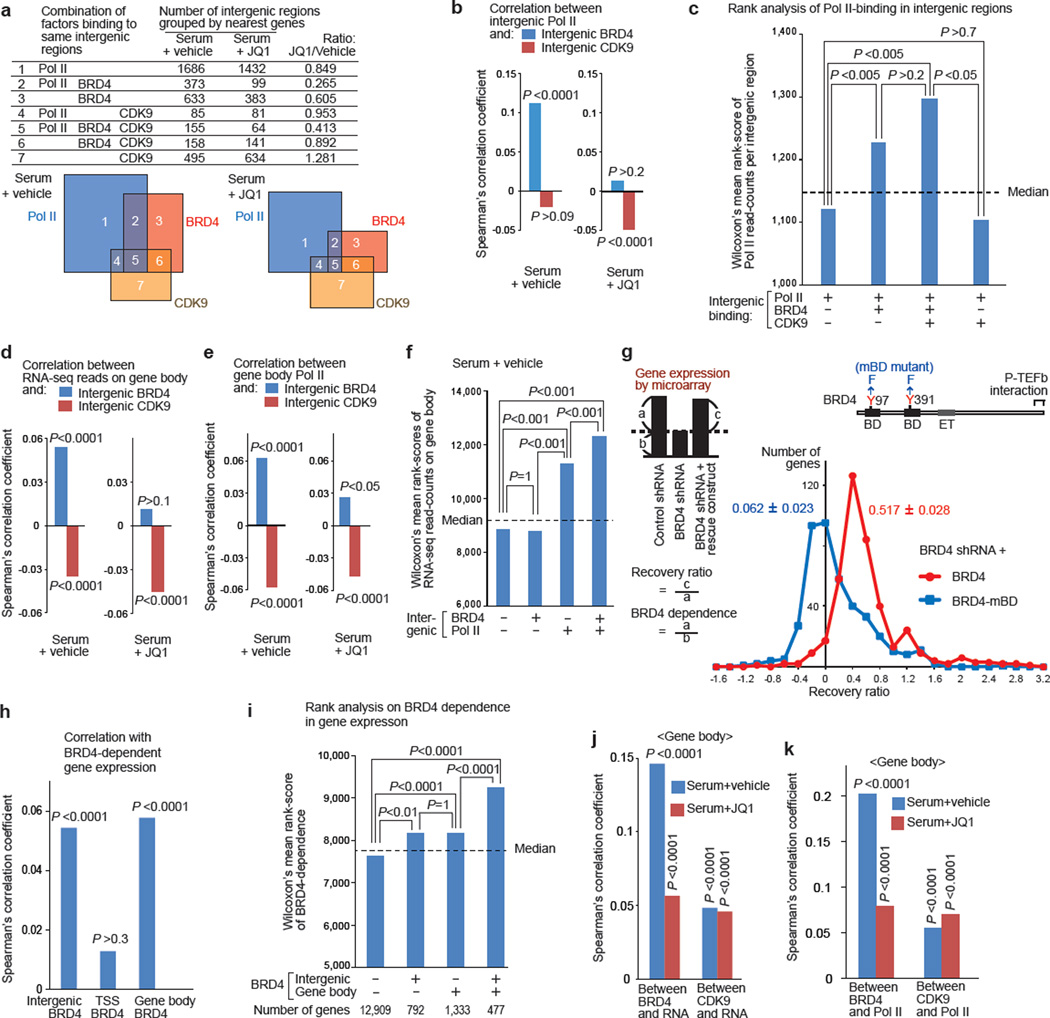
Figure 3. BRD4-dependent gene expression correlated with BRD4 enrichment in intergenic regions and on gene bodies, but not that at TSSs.
a, Combinations of Pol II (pan), BRD4, and CDK9 bindings in intergenic regions grouped by the nearest genes. The areas in Venn diagrams are proportional to the numbers listed. (b, d, e, j, k), Spearman’s rank correlation analysis: between intergenic BRD4 or CDK9 and intergenic Pol II (b); between intergenic BRD4 or CDK9 and gene-body chromatin RNA-seq reads (d) or Pol II (e); between BRD4 enrichment at distinct sites and the BRD4-dependence in gene expression as defined in g (h); and between BRD4 or CDK9 read-counts on gene bodies and chromatin RNA-seq read-counts (j) or Pol II read-counts (k). P-values represent the significance of correlation coefficients. (c, f, h, I), , Wilcoxon’s mean rank scores of Pol II read-counts in intergenic regions (c), chromatin RNA-seq read-counts on gene body (f), and BRD4-dependent gene expression (i), compared among the gene-classes as defined. Dotted line represents the median rank value, and P values were calculated using Dunn’s all-pair comparison method. g, Microarray analysis of gene expression in BRD4 knockdown cells reconstituted with a rescue construct (YFP-BRD4 or YFP-BRD4-mBD mutant). The distribution of the recovery ratio (RR) of genes repressed by BRD4 shRNA by more than 1.5 fold (n=410) is shown as the number of genes (y-axis) plotted against the RR (x-axis, binned by 0.2). Representative of two independent experiments, in which two independent cell lines per indicated transduction combination were analyzed.

