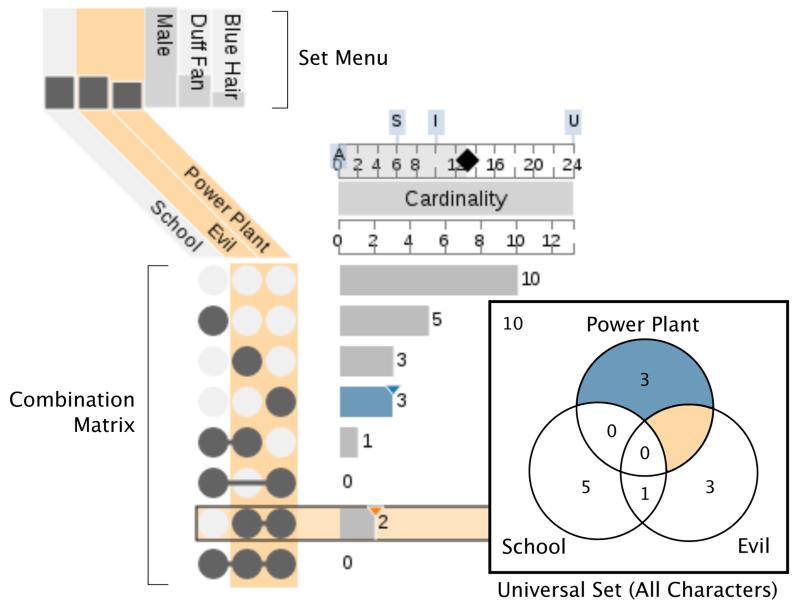
Fig. 4.
UpSet and an equivalent Venn diagram showing the Simpsons dataset. The combination matrix identifies the intersections, while the bars next to it encode the size of each intersection (cardinality). Among the 24 Simpsons characters in the dataset, two work at the power plant, are evil, and are not in school (highlighted in orange).

