Fig. 6.
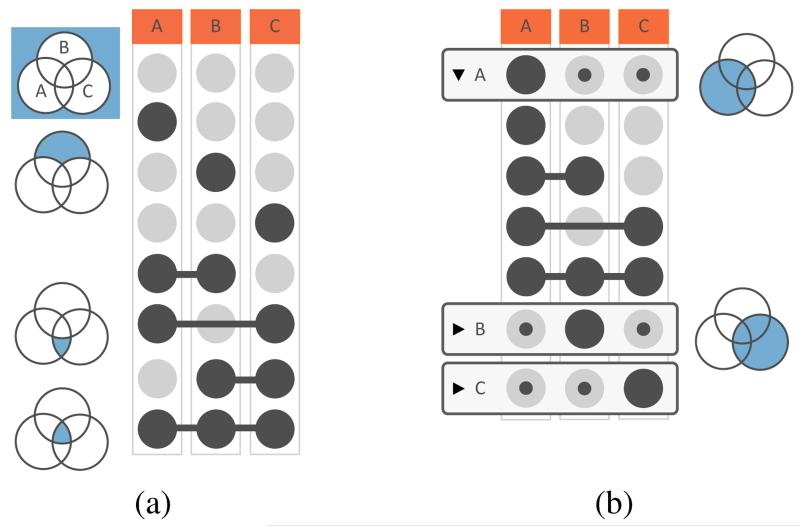
The combination matrix encoding the relationships between sets, aggregates and exclusive intersections. (a) Each row corresponds to an exclusive intersection that contains the elements of the sets represented by the dark circles, but not of the others. The equivalent segment in a Venn diagram is shown on the left. (b) Aggregates group exclusive intersections meaningfully. The first aggregate shows its contained exclusive intersections, while the second and the third aggregates are collapsed.

