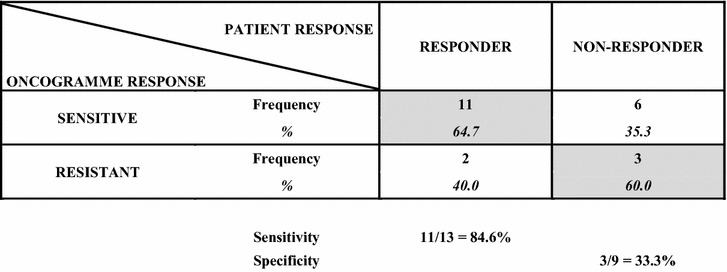
Table 5.
Correlation table matching patient responses with results of the Oncogramme assay (principal analysis)

Advanced CRC patient responses (responder or non-responder to treatment) were correlated with results of the Oncogramme assay (sensitive or resistant) to identify true positives (patients termed as sensitive and that actually responded to treatment) and true negatives (patients termed as resistant and that actually did not respond to treatment). True positives and true negatives are highlighted in grey. Sensitivity (percentage of true positives) and specificity (percentage of true negatives) are also given
