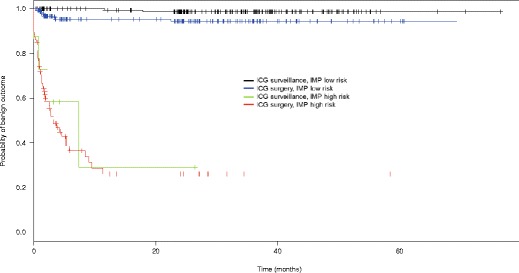
Fig. 1.

Kaplan-Meier analysis of time-to-malignancy in a multivariate model as predicted by IMP and ICG. Y-axis represents probability of benign outcome in patients after initial IMP test. X-axis represents time post initial EUS-FNA that patient outcomes were determined based on review of follow-up medical records
