
Figure 2.
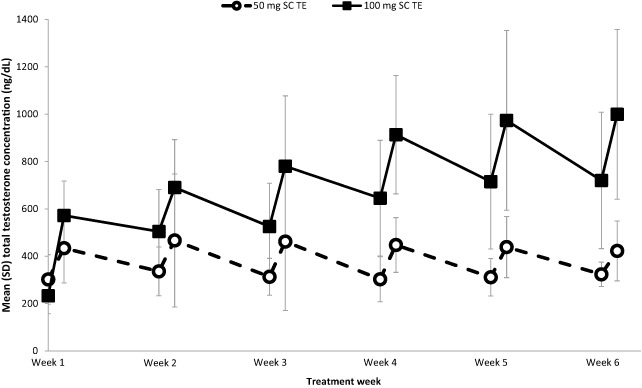
Mean pre‐dose and 24 hours post‐dose total testosterone concentration. Mean total testosterone (TT) concentrations for 50 (open circles) and 100 (closed squares) mg subcutaneous (SC) testosterone enanthate (TE) measured pre‐dose (0 hour) and 24 hours post‐dose at weeks 1–6. SD = standard deviation