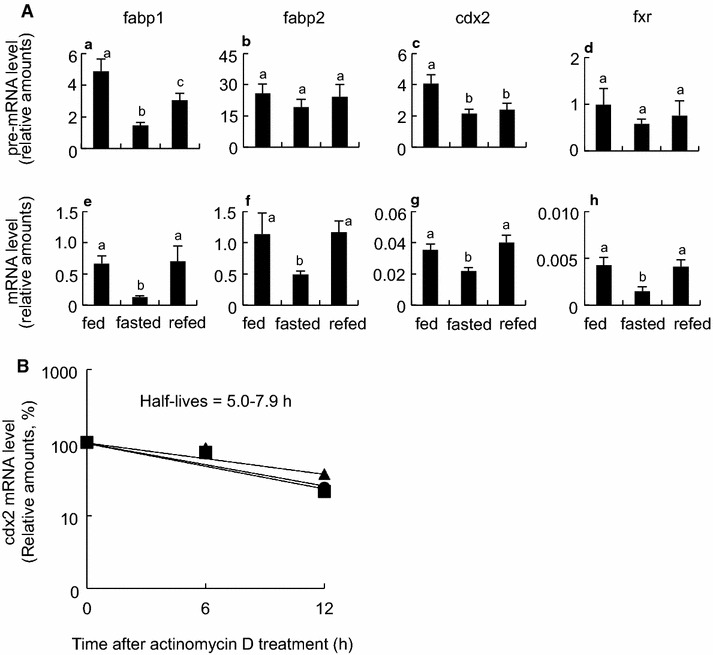
Fig. 6.

Post-transcriptional regulation of diet-response genes in the small intestine of X. laevis. A Comparison of pre-mRNA levels with matured mRNA levels of four fasting/refeeding-response genes. RNAs were prepared as shown in Fig. 3, and RT-qPCR (n = 8) was conducted using intron specific primers (a–d) and exon-specific primers (e–h) for fabp1 (a and e), fabp2 (b and f), cdx2 (c and g) and fxr (d and h) genes. Primers used in qPCR are shown in Additional file 6: Table S3. Each value is the mean ± SEM (n = 8). Distinct letters denote significantly different means (p < 0.05). B RT-qPCR of the cdx2 mRNA expression after treatment with actinomycin D. mRNAs were extracted from the primary tissue culture of the fed (circle), fasted (triangle) or refed (square) animals, as described in “Methods”. mRNA amounts at time 0 were set at 100 %. Depicted half lives were calculated using exponential regression. These experiments were repeated at least two times, with similar results
