
Fig. 3.
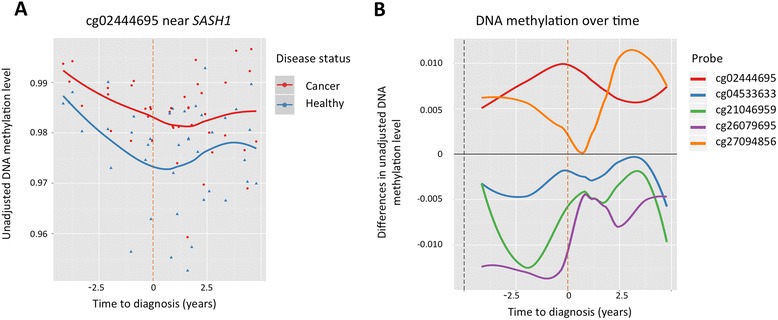
Differential methylation with respect to time of cancer diagnosis. a Unadjusted DNA methylation values at cg02444695 (near SASH1) in affected individuals (red) and healthy co-twins (blue), shown with respect to time of diagnosis (years) with smooth (LOESS) lines fitted for both groups. The orange vertical line represents the time of diagnosis. b Methylation differences within twin pairs at the four top-ranked DMPs and cg04533633 (at COX7C). Each smooth (LOESS) line represents the methylation difference (affected − unaffected twin) at an individual probe (see legend)