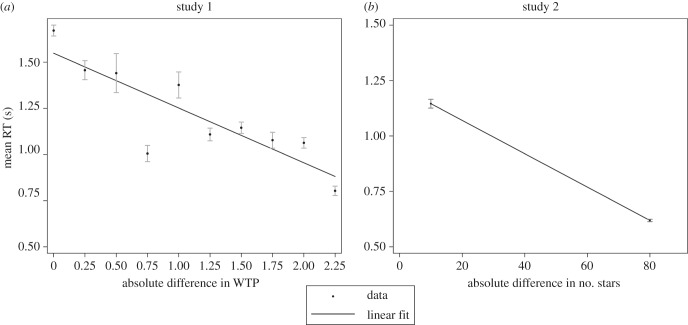
Figure 2.
RT versus difficulty. Mean RTs (black dots with standard error bars) as a function of (a) the difference in WTP between the two food items in study 1 (n = 49 subjects), and (b) the difference in the number of stars in study 2 (n = 40 subjects). Choice problems with a low absolute difference in the number of stars or WTP are more difficult and yield lower relative rewards from a correct decision. Although difficult choices benefit less from a correct decision, subjects spend more time on them, which reduces their earnings. Linear fits represent regressions of mean RT on absolute difference in WTP (study 1), and on the absolute difference in number of stars (study 2).

