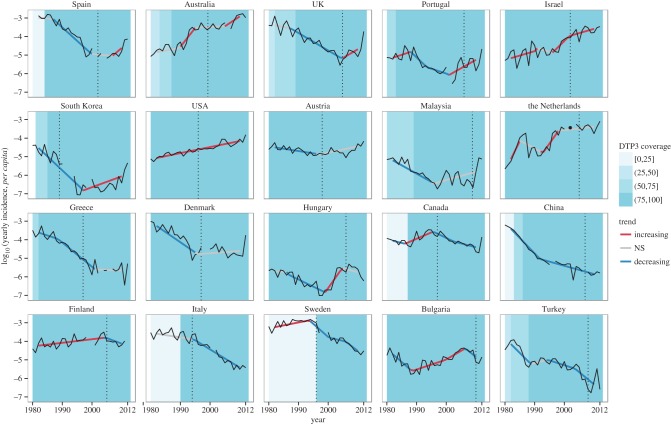
Figure 1.
Annual incidence data in 20 countries that switched to aP vaccines for primary immunization. We extracted 1980–2012 yearly case counts and pertussis vaccine coverage estimates from the WHO database (http://www.who.int/immunization/monitoring_surveillance/data/en/). For definiteness, we restricted our analysis to countries with more than 80% complete case count and more than 5 million inhabitants. Before analysis, incidence data were log10-transformed and a 5-year moving average was applied to remove the known 2–5 year cycles [21]. To detect long-term trends in pertussis reports, we proceeded in two steps. First, a series of segmented regression models with 0–3 breakpoints and time segments longer than 5 years were applied for each country [3,20]; of these, the most parsimonious model was selected according to the Bayesian information criterion. Second, to account for autocorrelation, we used generalized least-squares on each time segment identified in the first step, assuming the residuals autocorrelation structure followed an autoregressive process of order 1. For each country, the time segments were then classified according to their slope, as increasing (significantly positive slope), decreasing (significantly negative slope) or not significant. For each country, we represent the annual incidence (black solid lines), the fitted values from segmented regression, coloured according to the trend (red lines: significantly increasing; grey lines: no significant trend; blue lines: significantly decreasing), and the date of switch to aP vaccination (black vertical dotted lines). Coloured blue areas indicate the vaccine coverage for the third dose of DTaP vaccine. From left to right and top to bottom, countries are ranked by decreasing value of the last slope.

