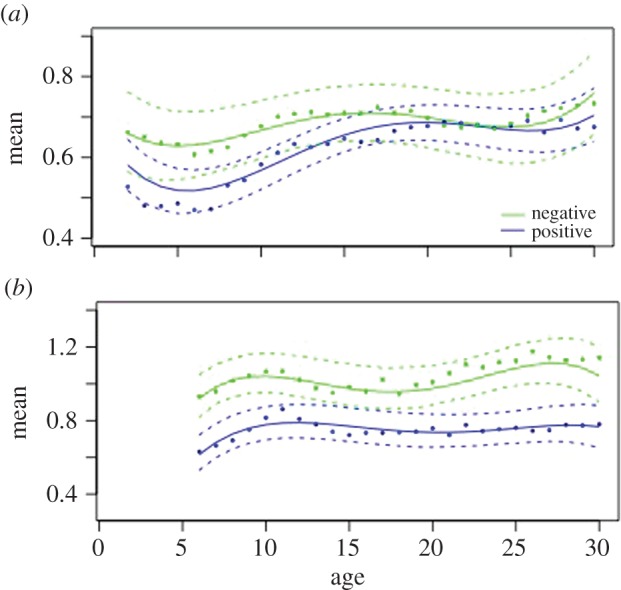
Figure 1.

Daily mean optical flow for (a) company 1 and (b) company 2 for Campylobacter-positive (blue) and Campylobacter-negative flocks (green). The solid lines show the best-fit fourth-order model for daily mean values (daily means of mean optical flow). The dots represent the actual observed daily mean values and the dashed lines are the 95% confidence limits for bootstrapped model data. The x-axis is the age in days.
