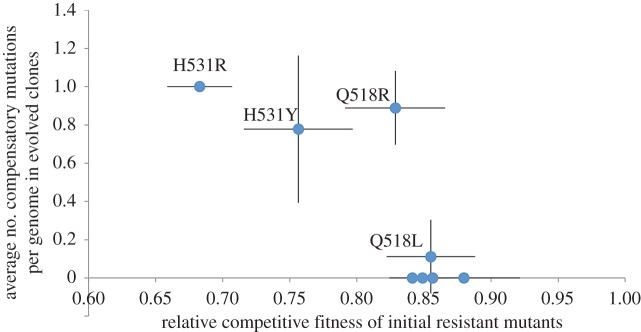
Figure 3.
High fitness costs drive compensatory adaptation in rifampicin-resistant populations of P. aeruginosa. This graph shows the number of compensatory mutations in RNA polymerase per evolved isolate (mean ± s.e; n = 3) as a function of fitness cost associated with the eight rifampicin resistance mutations (mean ± s.e; n = 3). We included the reversion mutation in this analysis, because it is an adaptation to the cost of rifampicin resistance. The mean number of compensatory mutations per isolate increases with the cost of resistance, as judged by a Spearman's rank-order correlation (p < 0.05). (Online version in colour.)

