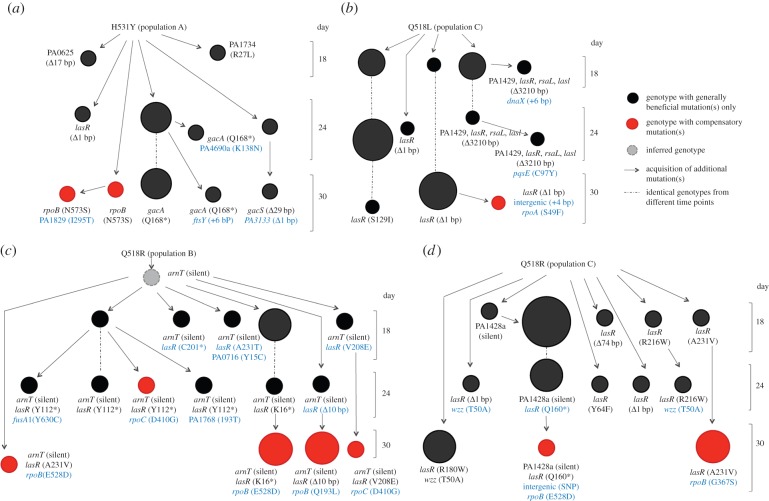
Figure 4.
Clonal interference constrains compensatory adaptation. A schematic diagram representing the phylogeny inferred for six randomly selected isolates sampled from the 18th, 24th and 30th (final) days for four populations in which the co-occurrence of generally beneficial mutations and compensatory mutations was detected in the endpoint populations. Circles represent the observed genotypes, and the diameter of a circle indicates the frequency of that isolate in the population (n = 1, 2 or 3). Red circles denote isolates carrying compensatory mutations, while black circles denote isolates carrying generally beneficial mutations but not compensatory mutations. Each thin arrow represents the acquisition of one or more additional mutations with respect to the previous genotype. Mutations carried by individual isolates are shown in text, with newly acquired mutations in blue and previously acquired mutations in black.

