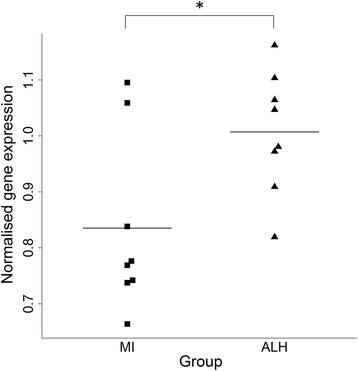
Fig. 2.

Bee swarm plot showing normalised gene expression values for FANCI in the married-in control (MI) and affected carriers of the linked haplotype (ALH) groups. FANCI expression was measured in lymphoblastoid cell lines using qRT-PCR and was normalised to the geometric mean of ATP5B, RPLP0 and UBC. *p ≤ 0.05
