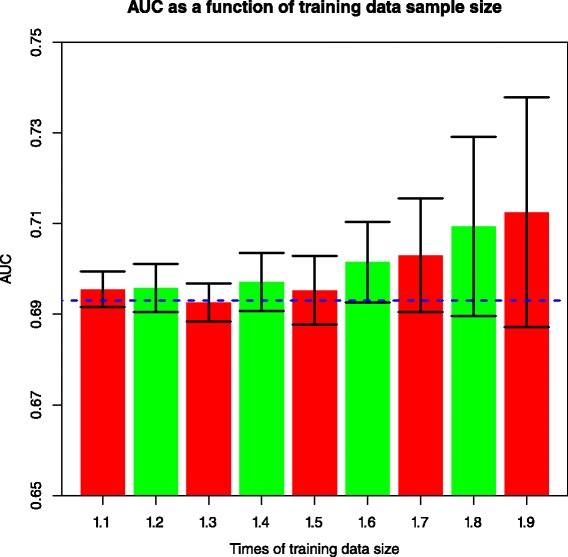
Fig. 3.

Relationship between training dataset with more samples and AUC in the model testing dataset, when moving samples from fold3 to fold2. 10 % of fold2 corresponds to 129 cases and 312 controls. Error bars with one standard deviation of 10 reruns are shown. Blue horizontal dashed line indicates AUC of fold3 when 100 % of the fold2 data were employed to train the LR model
