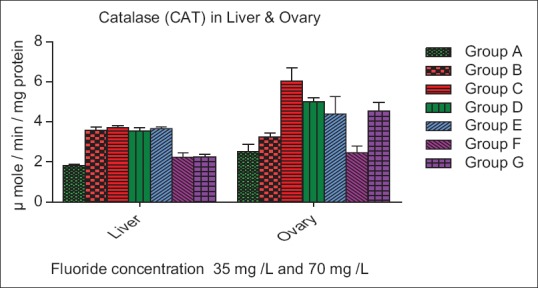
Figure 4.

Effect of ascorbic acid and fluoride on the Catalase level. The value represents the mean ± standard error mean (n = 6). Group A: Control, Group B: Fluoride (35 mg F ion/L), Group C: Fluoride (70 mg F ion/L), Group D and E: Pretreatment, Group F and G: Post treatment
