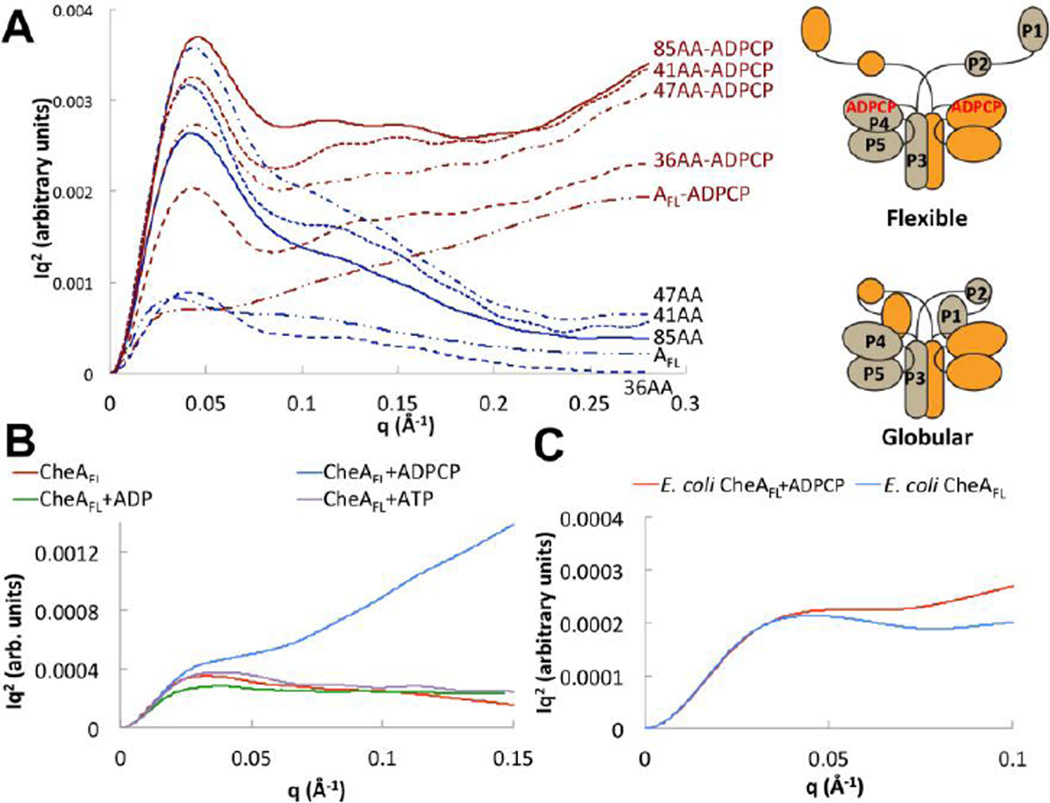
Figure 2. Small-angle x-ray scattering indicates two CheA conformational states that depend on P1 and nucleotide.
(A) Kratky plots (I(q)q2 vs. q) of CheAFL and ΔP2 variants (3 mg/mL) with (red) and without (blue) ADPCP. A cartoon depicts the possible conformational transition suggested by the SAXS data. P3P4P5 shows no change in conformation with ADPCP (Figure S3). (B) Kratky plot of T. maritima CheAFL (3 mg/mL) without (red) and with ADPCP (blue), ADP (green) and ATP (purple) all at 5 mM. Only ADPCP increases CheA flexibility. (C) Kratky plot of E. coli CheAFL (5 mg/mL) without (blue) and with (red) 5 mM ADPCP. E. coli CheA also shows increased flexibility with ADPCP. SAXS curves are shown after smoothing and regularization. See Table 1 for SAXS parameters and SI Fig. 5 for dimensionless Kratky analysis of unsmoothed data.

