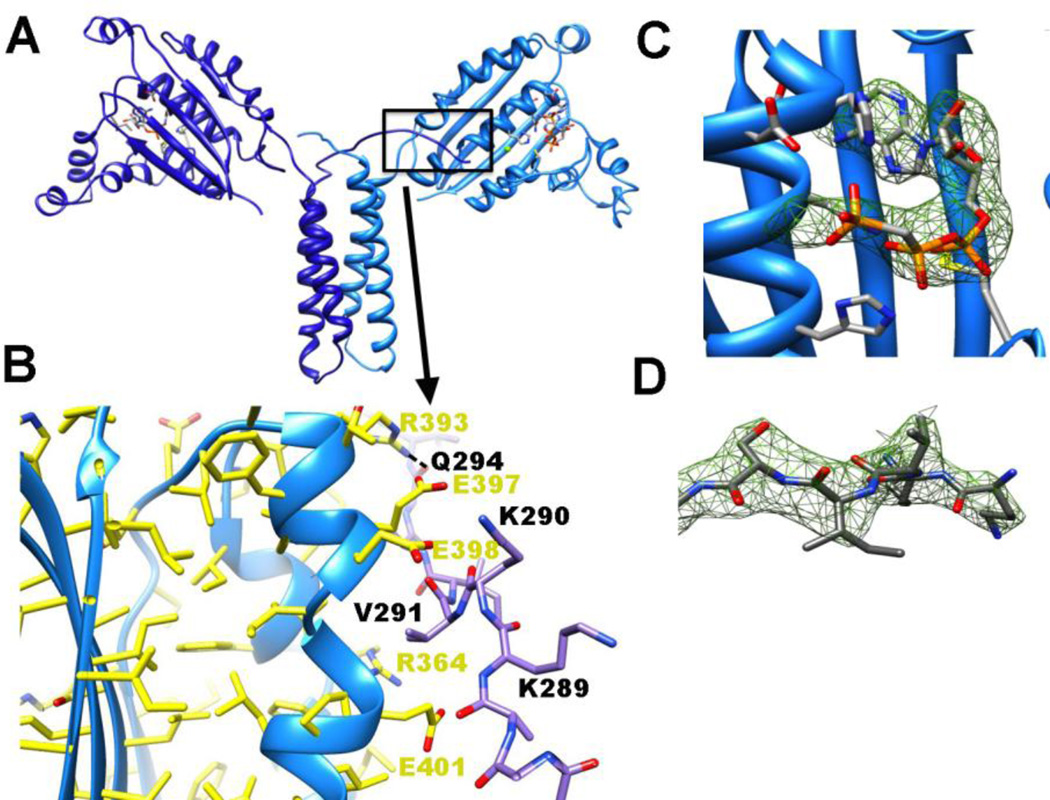
Figure 5. P3P4 crystal structure.
(A) 3.0 Å resolution of P3P4 (light and dark blue ribbons denote the subunits) with ADPCP (orange bonds) bound in P4. The P3 and P4 domains roughly form a plane and residues 289–293 in the N-terminal linker project toward the ATP-binding pocket of the opposing subunit. (B) The N-terminal P3 linker of one subunit (dark blue bonds) interacts with the P4 domain of another (light blue ribbons and yellow bonds) by binding along side a break in helix α4. Hydrogen bonds are formed between the side chains and main chains of residues on each subunit and favorable electrostatics between negatively charged residues on P4 (Glu297, Glu298, and Glu401) and positively charged residues on the linker (Lys289, Lys290) may stabilize the contact. (C,D) Omit electron density (green mesh) for ADPCP within the ATP binding pocket (C) and (D) residues 289–293 from the C-terminal end of the P2-P3 linker (both shown at 3 σ).

