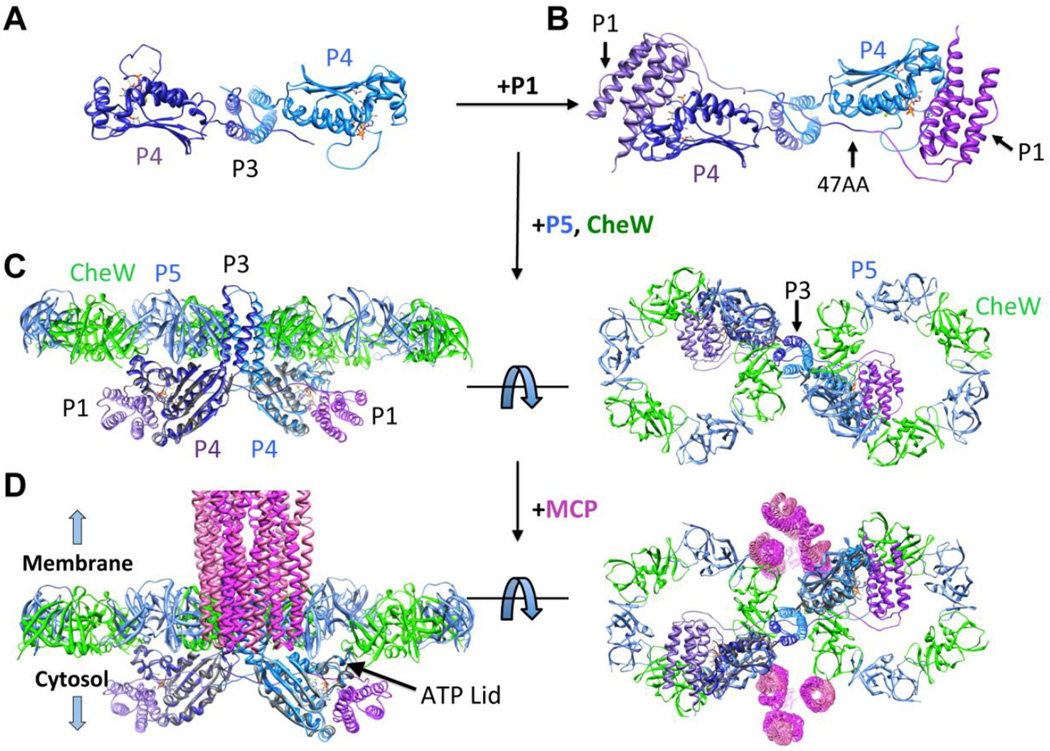
Figure 6. P3P4 crystal structure and model.
(A) Structure of P3P4 (each subunit colored as light and dark ribbons) obtained with ADPCP (orange bonds) present in the nucleotide-binding pocket. View is perpendicular form Fig. 5A. (B) Model of P1 (light and dark purple ribbons) near the P4 ATP-binding pocket in 47AA. (C) CheA P3P4P5 structure based on the P3P4 conformation with CheW/P5 ring overlay [18]. (D) Model of CheA within the array. Trimers of receptor dimers (magenta) [85] located at the vertices of the hexagonal P5/CheW rings are shown from the side and below. The P3P4 structure predicts that the ATP-lids of the P4 domains will be oriented up toward the P5-CheW layer.

