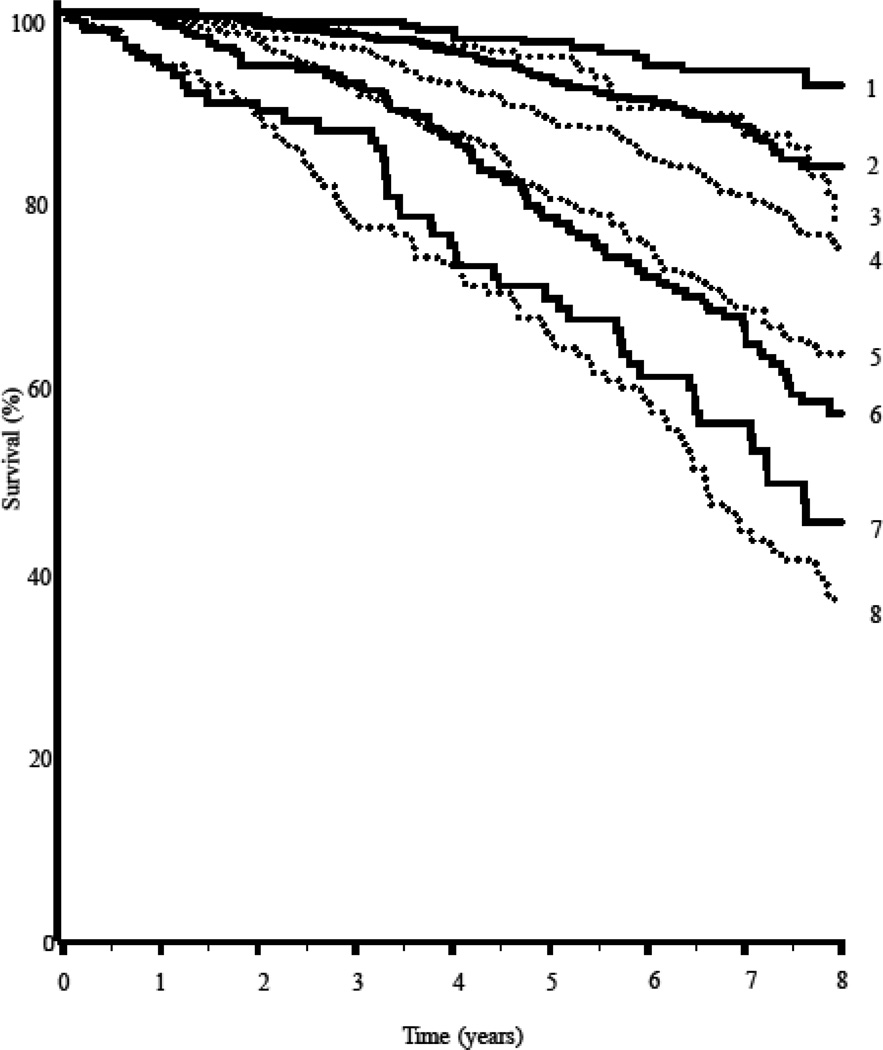
Figure 1.
Survival curve showing the percentage of survivors according to their baseline frailty levels and sex; 1 = females Frailty Index ≤0.10 (fit); 2 = females 0.10<Frailty Index to ≤0.20 (at risk); 3 = males Frailty Index ≤0.10 (fit); 4 = males 0.10<Frailty Index to ≤0.20 (at risk); 5 = males 0.20<Frailty Index ≤0.30 (frail); 6 = females 0.20<Frailty Index ≤0.30 (frail); 7 = females FI >0.30 (frailest); 8 = males FI >0.30 (frailest).

