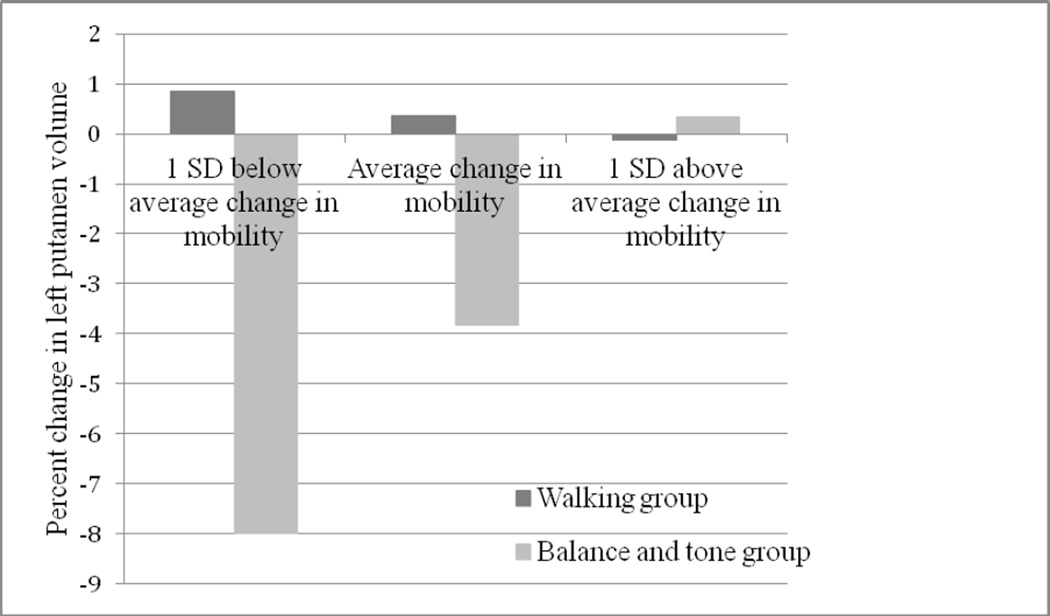
Figure 1.
Percent change in left putamen volume as a function of change in mobility and group (walking vs. balance and tone). Negative values of percent change in left putamen volume represent decreases in volume over time. Change in mobility represents average change in TUG scores + 1 SD. The association between change in volume of the left putamen and change in mobility is moderated by type of exercise, where change in left putamen volume remains stable across change in mobility in the walking group, whereas left putamen volume depends on change in mobility in the balance and tone group.

