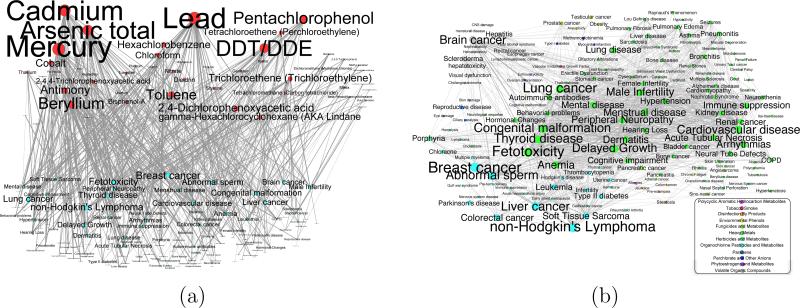
Fig. 3.
Phenotype-Substances Network. (a) The Bipartite Network. Top row, red vertices: environmental chemical substances. Bottom row, blue vertices: human phenotypes and diseases. Vertex size is proportional to the degree. (b) Projections onto the Phenotype Space. Nodes are colored according to their (majority) substance group according to the legend. Node sizes are proportional to the number of substances associated. Edge weights and width represent the number of shared substances.

