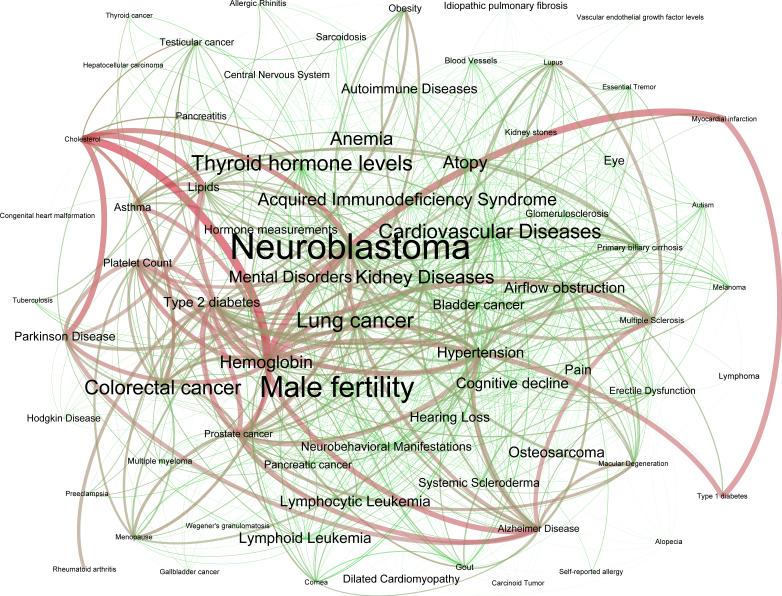
Fig. 5.
Filtered Substance-Exposure HPN: Projection of the substance-phenotype-pathway tripartite networks onto the phenotype space filtered to retain only edges and vertices that share both substance and genetic interactions. Vertex size is proportional to the total number of associated substances; vertex color is proportional to the number of biological pathways associated (green for fewer and red for more). Edge width is proportional to the number of shared pathways; edge color is proportional to the number of shared substances (green for fewer, 1 pathway, and red for most: 10 pathways).

