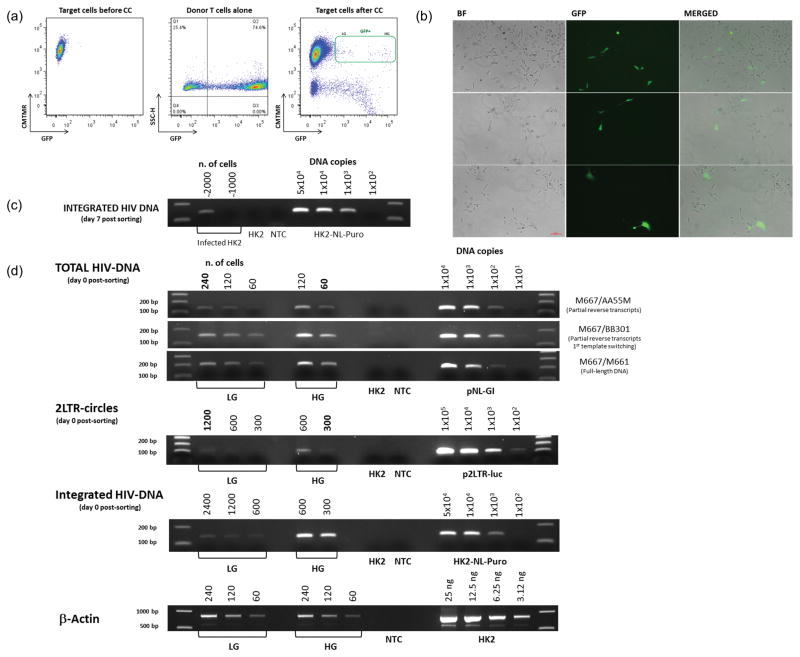
Figure 1. HIV-1 directed GFP expression and integration in renal epithelial cells.
(a) HK2 cells were co-cultivated overnight with CEM T cells infected with NL-GI. 48h post-coculture HK2 cells double positive for GFP and CMTMR were flow sorted and replated. Two distinct populations, low expressing GFP (LG) VS high expressing GFP (HG), were identified among the GFP positive HK2 cells. (b) Fluorescence microscopy analysis of flow sorted GFP positive HK2 at day 4 post-sorting. (c) DNA was extracted from cells cultivated for 7 days post sorting and analyzed for integrated HIV-1 DNA. (d) High GFP (HG) and the Low GFP (LG) expressing populations of infected HK2 cells were flow sorted separately. Genomic DNA was extracted from those cells and analyzed for the presence of total HIV-1 DNA, integrated HIV-1 DNA and 2-LTR circles. PCR reactions were performed as described in Table 1. The number of cells or DNA copy number for the standard curves is indicated on top of each lane. Negative controls include cells without HIV-1 and PCR reactions with no template (NTC). PCR products were identified on 2% agarose gels stained with ethidium bromide. PCR amplification of the reference gene β-Actin was used as loading control. Representative of four independent experiments.

