
Figure 4.
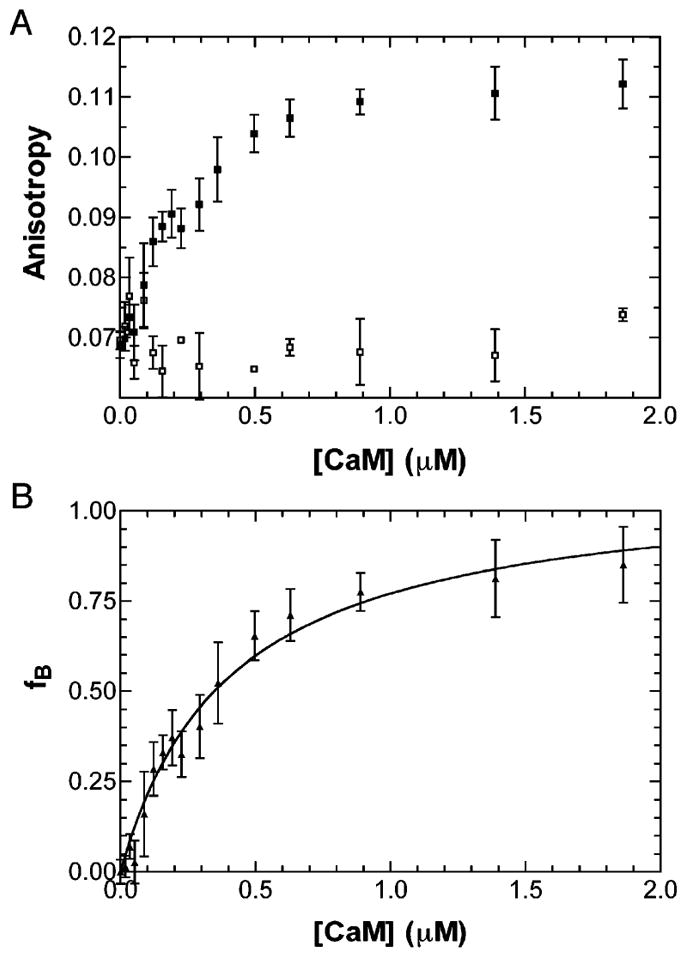
Determination of the PerCter–Ca2+/CaM disassociation constant. (A) Trp fluorescence anisotropy of the PerCter at increasing CaM concentration. A 2 μM PerCter solution was titrated with CaM as detailed in Materials and Methods in the absence of 4 mM EGTA (■) and in the presence of 4 mM EGTA (□). (B) fB (or fraction bound) at increasing CaM concentrations determined from steady-state Trp fluorescence anisotropy. The curve was fit assuming a single binding site, and the average disassociation constant of at least four titrations was determined to be 320 ± 150 nM. The error bars represent the standard deviation of at least three independent measurements.