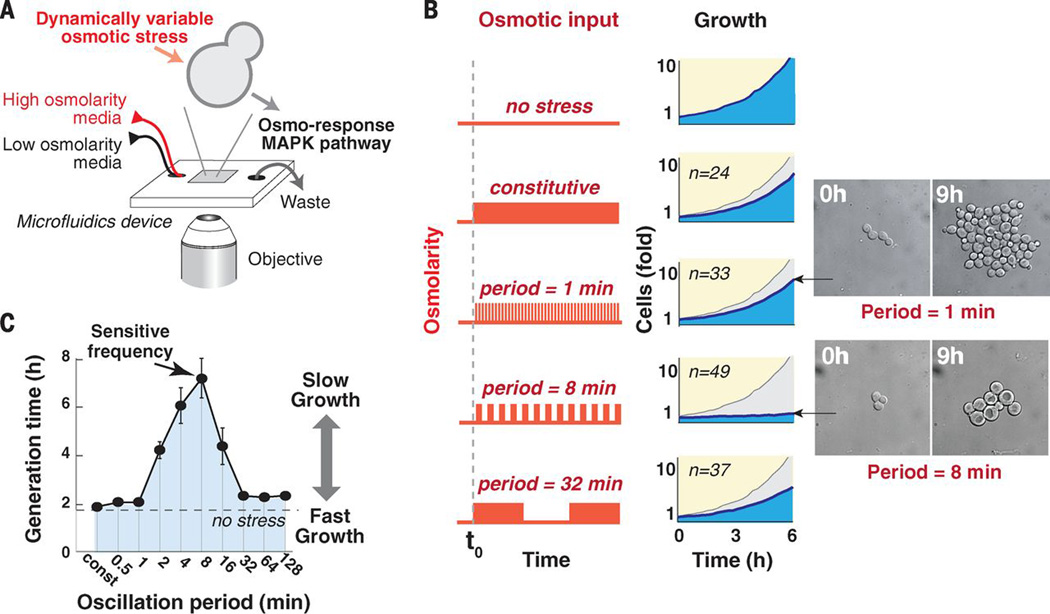
Fig. 1.
Osmotic oscillations at an intermediate frequency cause slow proliferation. (A) Schematic of the flow chamber used. (B) Cell growth under various frequencies of mild osmostress (0.4M KCl). The graphs show the average number of progeny cells relative to the number of cells before stress is applied (n shows the number of parental cells monitored). Growth without osmotic stress is shown in gray. The inset shows representative images of cells. (C) A systematic frequency scan of mild osmotic oscillations (0.4M KCl). The graph shows the mean doubling time over a period of 8h. Each point marks the mean generation time calculated from at least 50 individual sets of progeny in two biological repeats, bars mark the standard error.

