
Figure 5. P5SA-2 leads to disintegration of regulatory domain contacts.
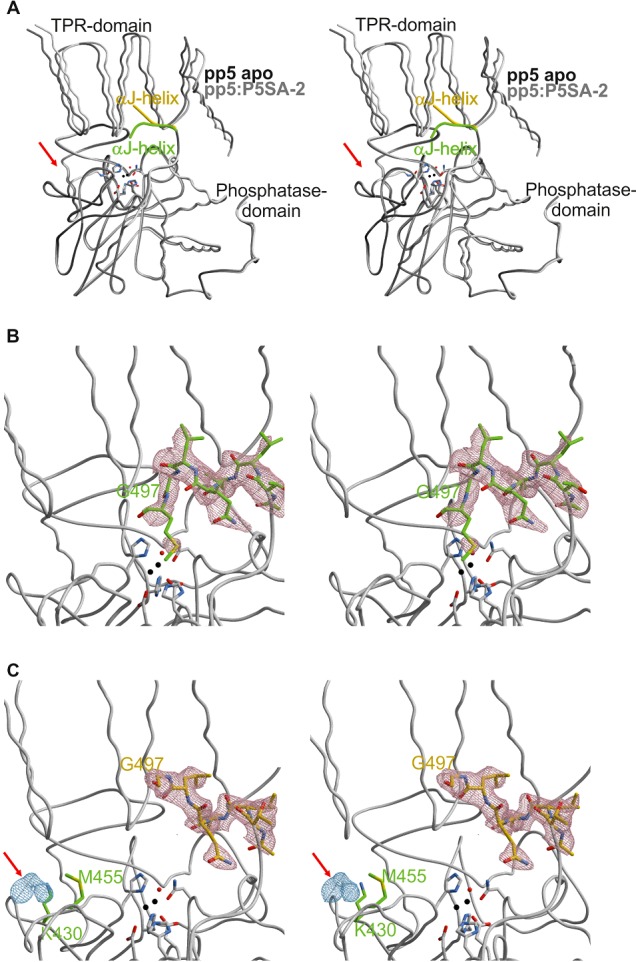
(A) Stereo view of the backbone superposition of both molecules shown as ribbon plots: PP5 apo with αJ-helix in dark grey and green, PP5–P5SA-2 with αJ-helix in light grey and yellow. The position of the additional electron density which is only visible in the PP5–P5SA-2 structure is indicated by a red arrow. Active site residues are depicted as sticks and the two magnesium ions (black) and one water molecule (red) are shown as balls [also in (B) and (C)]. (B) Stereo view of the 2Fo-Fc electron density map (countered at 1σ) for the αJ-helix (T492–M498) of PP5 apo, in which the αJ-helix has been removed for phase calculations. The position of Gly497 is indicated. (C) Stereo view of the 2Fo-Fc electron density map (at 1σ) for the αJ-helix (T492–G497) of PP5 in complex with P5SA-2. The electron density depicted in blue at 1σ indicates the potential binding site of the ligand P5SA-2. The indicated regulatory binding pocket for P5SA-2 was confirmed by mutational studies.