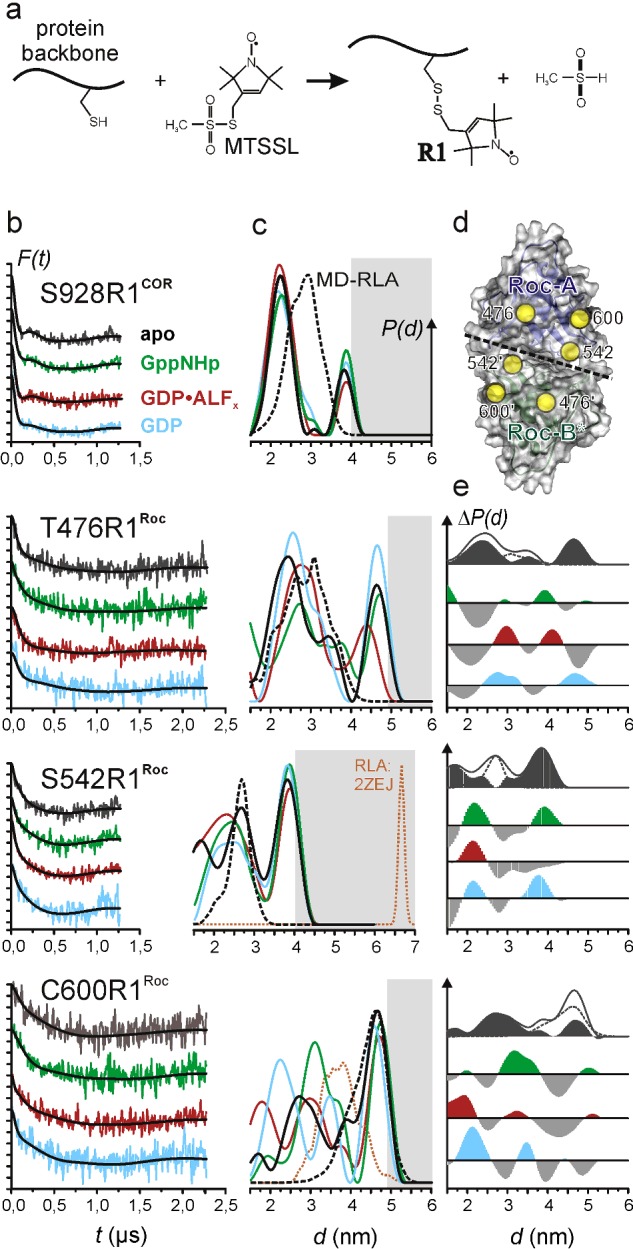
Figure 2. Interprotomer distances in CtRocCOR.

(a) Site-directed spin labelling. After site-directed mutagenesis to replace the residue of interest by cysteine, reaction of the MTSSL with the thiol group of the cysteine yields the spin-label side chain commonly abbreviated as R1. (b and c) DEER data recorded at X band (9.3–9.4 GHz). (b) Background-corrected dipolar evolution data F(t). Tick marks are separated by 0.05. (c) Distance distributions P(d) obtained by Tikhonov regularization (solid lines) and by MD-RLA (see text) of the dimer model shown in Figure 1 (a; black, dashed) or the dimer structure of LRRK2–Roc (pdb: 2ZEJ; orange, dashed). (d) Bottom view of the Roc dimer in the model (Figure 1 a), showing the locations of the label positions marked by spheres at the positions of their Cα atoms. The interface between the two Roc domains is marked by a dashed line. (e) Difference distance distributions ΔP(d). From top to bottom: P(d)apo–P(d)MD-RLA, P(d)GppNHp–P(d)apo, P(d)GDP-AlFx–P(d)apo, P(d)GDP–P(d)apo. The P(d)apo–P(d)MD-RLA plots are shown together with both P(d)s. Positive contributions in ΔP(d) for the nt-bound states are coloured according to the data in (a) and (b). Negative contributions are shown in grey. The difference amplitudes have been scaled for better visualization.
