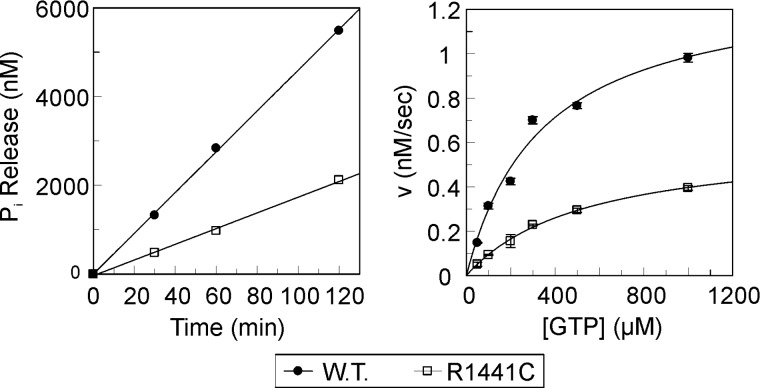
Figure 3. GTPase activity of human LRRK2 Roc-COR-kinase fragments.
Left: Inorganic phosphate release of 100 nM LRRK2 protein incubated with 500 μM γ32P-GTP during the indicated time. The slopes of the linear fits of phosphate release at different time-points yield the reaction rates (v). Right: The reaction rates (v) of wild-type and the R1441C PD-mutant of human LRRK2 Roc-COR-kinase proteins are plotted against substrate (GTP) concentration. The error bars show the standard error of the reaction rate calculated from at least three measurements. kcat and Km values are calculated by fitting the data with the Michaelis–Menten equation using GraFit (Erithacus Software).

